Agriculture, Forestry, and Fisheries
Understanding the Guatemalan food basket
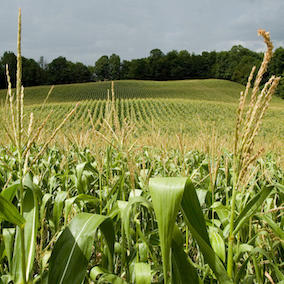
How natural capital accounting revealed that a country that feeds on maize and beans leaves the production of these crops entirely up to climate variability.
The System of Environmental-Economic Accounting for Agriculture, Forestry and Fisheries (SEEA AFF) is a framework that describes the relationship between the environment and the economy with an emphasis on agriculture, forestry and fisheries (FAO, 2015).
On the one hand, it allows us to determine the level of stocks that are present in the production, processing and consumption of food, and other environmental services ascribed to agriculture, forestry, and fisheries. It also tracks the flows of natural inputs between the environment and the economy, as well as within the economy of these and other sectors. Finally, it also reflects environmental degradation that can occur from these exchanges.
The SEEA AFF aims to keep track of the following data domains and base accounts:
Guatemala became one of the test cases of SEEA AFF and we conducted a pilot compilation with existing information of the SEEA Central Framework already present for 2010, in order to assess what was possible and identify information gaps on which more detailed work is needed. Nonetheless, some of the preliminary findings are already revealing.
For example, table 1 shows the output and import of various crops in metric tons for Guatemala in 2010. In terms of volume, sugar cane was by far the largest output of this group of products, followed by the production of bananas and maize. But if we were to take out sugar cane and bananas from this comparison because of their highly industrialized nature geared towards exports, we could quickly see that maize took up a third of the remaining products combined supply. Maize was followed closely by the group called “other vegetables” with a share of output of 16% and “other fruits” with 12% of this more limited group (without sugar cane and bananas).
It is also interesting to see that the production of beans, which are a staple food for Guatemalans, was not as large in terms of volume as that of maize. It represented 5% of total supply, which was comparable to wheat (6%), potatoes (6%), and other seeds and oily fruits (5%).
The external dependence of several products is also noteworthy. For example, most wheat was imported (99.7%). Also, 70% of unprocessed rice came from imports also. In as much as maize has been a part of the Guatemalan diet for centuries, about 21% of it was imported. And even if supply of soy might not be important in terms of volume, a third of it came from imports.
Table 1. Physical supply account for crops in 2010. (metric tons)
| Agricultural industries | Manufactures, utilities, and services | Imports | Total | |
|---|---|---|---|---|
| Coffee, not roasted, not decaffeinated | 242,595 | 244 | 39 | 242,877 |
| Bananas | 2,637,570 | 0 | 2,136 | 2,639,706 |
| Maize (corn) | 2,327,800 | 1 | 630,100 | 2,957,901 |
| Rice, not husked | 29,593 | 0 | 67,585 | 97,177 |
| Wheat and meslin | 1,493 | 0 | 492,356 | 493,849 |
| Beans | 441,066 | 0 | 23,900 | 464,966 |
| Other vegetables, fresh or chilled n.e.c. | 1,362,470 | 0 | 32,030 | 1,394,501 |
| Other fruits | 984,820 | 64 | 84,264 | 1,069,148 |
| Soybeans | 7,755 | 0 | 3,813 | 11,569 |
| Sugar cane | 19,364,100 | 4,232 | 0 | 19,368,332 |
| All other crops | 1,946,607 | 3,443 | 89,556 | 2,039,605 |
| Total | 27,399,262 | 4,540 | 1,336,224 | 28,740,025 |
Source: Iarna/Banguat (2010)
In terms of use of the same products, we grouped economic activities in a way that would make it more easy to identify the various steps in the food production chain. For that reason, we have industries that use crops as seed inputs, others that use it as animal feed, the food processing industry, hotels and restaurants, and the remaining industries of Guatemala, along with households and exports.
The decision to group industries that would naturally use crops as feed for animals had the intention of addressing the concern of large portions of the earth’s surface being cleared for the production of animal food. Figure 1 shows that the largest users of agricultural supply were manufactures, households, and the rest of the world (exports); not industries for feed. The figure is color coded in a way that makes evident the column with the biggest use share for each product showing in a darker blue. It would be reasonable to think that grain would be used by manufactures for the production of animal foods, but as we’ll see later, volumes of those products were not relevant in the data. In the case of “soybeans” the data revealed that there was no use as feed, but an important share of their volume was used as seed (40%).
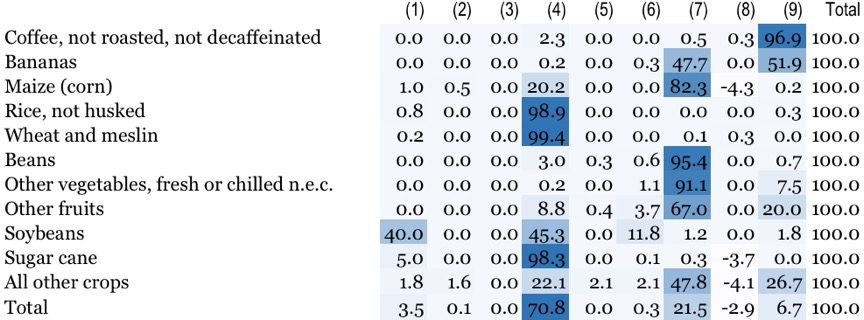
(1) Agricultural industries that use crops as seed; (2 Agricultural industries that use crops as feed; (3) Other agricultural industries; (4) Food processing industries; (5) Other industries; (6) Hotels and restaurants; (7) Households; (8) Stock variation; (9) Exports
Figure 1. Physical use account for crops in 2010 (percentages)
It is interesting to pay attention to the share of some products that is used by the food processing industry at the national level (in the manufactures column). For example, in the case of maize, only 20% of all used volume had a final destination in the food processing industries. This is consistent with the 80% (adjusted to extract the negative stock variation) that was consumed by households. It contrasts with the 99% of the supply of unprocessed rice and wheat that was used almost exclusively by the food processing industries. This does not mean that households didn’t consume these products. It only means that they did so in their processed versions, such as precooked white rice and dehydrated breakfast gruel. As an example of this, the totality of sugar cane was used by the food processing industry.
Aside from these exceptions, households did consume large volumes of cultivated products directly, which is consistent with the traditional market culture still present in most of the country. For example, they used 95% of beans, 88% of potatoes, 97% of other roots and tubers, 99% of fresh culinary herbs, 91% of other vegetables and 67% of all fruits, among others.
Table 2. Supply of processed foods. (metric tons)
| Agricultural industries | Manufactures, utilities, and services | Imports | Total | |
|---|---|---|---|---|
| Legumes and other preserved vegetables | 0 | 0 | 35,039 | 35,039 |
| Fruit juices and vegetable juices | 0 | 29,374 | 23,523 | 52,897 |
| Fruit and nuts | 0 | 2,853 | 401 | 3,254 |
| Jams, fruit jellies and fruit or nut puree | 0 | 16,331 | 15,260 | 31,592 |
| Other preserved fruits | 0 | 45 | 0 | 45 |
| Vegetable oil | 0 | 61,248 | 125,167 | 186,415 |
| Vegetable fats (except maize oil) | 0 | 0 | 0 | 0 |
| Margarine and similar preparations | 0 | 2,281 | 8,656 | 10,937 |
| Flours and meals of oil seeds or oleaginous fruits | 0 | 0 | 368,656 | 368,656 |
| Husked rice | 0 | 0 | 3,457 | 3,457 |
| Wheat or meslin flour | 0 | 0 | 17,210 | 17,210 |
| Cereal flours other than of wheat or meslin | 0 | 0 | 114,942 | 114,942 |
| Preparations used in animal feeding n.e.c. | 0 | 18,367 | 33,559 | 51,926 |
| Crispbread; rusks, toasted bread and similar toasted products | 0 | 1,680 | 11 | 1,691 |
| Gingerbread and the like; sweet biscuits; waffles and wafers | 0 | 10,313 | 34,571 | 44,885 |
| Raw cane or beet sugar | 0 | 1,743,340 | 28 | 1,743,368 |
| Refined cane or beet sugar, in solid form, containing added flavouring or colouring matter | 0 | 0 | 175 | 175 |
| Molasses | 0 | 304,311 | 1,129 | 305,440 |
| Sugar confectionery (including white chocolate), not containing cocoa | 0 | 0 | 0 | 0 |
| Uncooked pasta, not stuffed or otherwise prepared | 0 | 12,194 | 8,558 | 20,752 |
| Total | 0 | 2,202,337 | 790,342 | 2,992,680 |
Source: Iarna/Banguat (2010)
Also, we take note of the relative importance in terms of volume of fruit juices (52,897 tm), other bakery and pastry products (44,885 tm), preserves, fruit marmalades, purees and fruit pastes (31,592 tm), as well as that of prepared or canned legumes (35,039 tm). We can find canned refried beans in this last category, which have become increasingly popular in the Guatemalan diet.
As illustrative as the supply of foods is in understanding food security topics, evaluating the use of those foods within the economy has more explanatory power. Table 3 shows that households consume about 23% of the volume of prepared legumes, while 68% becomes exports, and it also shows that they use about 73% of canned fruits. It is also relevant that only 36% of processed rice goes to households, while 62% becomes exports. Households also use about 20% of wheat flour and 60% of other types of flour.
Table 3. Use of processed foods. (metric tons)
| (1) | (2) | (3) | (4) | (5) | (6) | (7) | Total | |
|---|---|---|---|---|---|---|---|---|
| Legumes and other preserved vegetables | 0 | 2,117 | 1 | 170 | 8,100 | 612 | 24,039 | 35,039 |
| Fruit juices and vegetable juices | 0 | 0 | 0 | 0 | 0 | 0 | 52,897 | 52,897 |
| Fruit and nuts | 0 | 0 | 0 | 0 | 0 | 0 | 3,254 | 3,254 |
| Jams, fruit jellies and fruit or nut puree | 0 | 0 | 0 | 0 | 0 | 0 | 31,592 | 31,592 |
| Other preserved fruits | 0 | 7 | 0 | 2 | 33 | 3 | 0 | 45 |
| Vegetable oil | 0 | 0 | 0 | 0 | 0 | 0 | 186,415 | 186,415 |
| Vegetable fats (except maize oil) | 0 | 0 | 0 | 0 | 0 | 0 | 0 | 0 |
| Margarine and similar preparations | 0 | 0 | 0 | 0 | 0 | 0 | 10,937 | 10,937 |
| Flours and meals of oil seeds or oleaginous fruits | 0 | 236,062 | 14,123 | 75,642 | 12,951 | 7,288 | 22,589 | 368,656 |
| Husked rice | 0 | 21 | 1 | 85 | 1,257 | -38 | 2,131 | 3,457 |
| Wheat or meslin flour | 0 | 4,716 | 1 | 33 | 3,358 | 34 | 9,069 | 17,210 |
| Cereal flours other than of wheat or meslin | 0 | 9,463 | 736 | 81 | 70,259 | 2,275 | 32,128 | 114,942 |
| Preparations used in animal feeding n.e.c. | 0 | 0 | 0 | 0 | 0 | 0 | 51,926 | 51,926 |
| Crispbread; rusks, toasted bread and similar toasted products | 0 | 0 | 0 | 0 | 0 | 0 | 1,691 | 1,691 |
| Gingerbread and the like; sweet biscuits; waffles and wafers | 0 | 0 | 0 | 0 | 0 | 0 | 44,885 | 44,885 |
| Raw cane or beet sugar | 0 | 0 | 0 | 0 | 0 | 0 | 1,743,360 | 1,743,360 |
| Refined cane or beet sugar, in solid form, containing added flavouring or colouring matter | 0 | 4 | 2 | 0 | 23 | -4 | 149 | 175 |
| Molasses | 0 | 0 | 0 | 0 | 0 | 0 | 305,440 | 305,440 |
| Sugar confectionery (including white chocolate), not containing cocoa | 0 | 0 | 0 | 0 | 0 | 0 | 0 | 0 |
| Other sugars | 0 | 0 | 0 | 0 | 0 | 0 | 0 | 0 |
| Uncooked pasta, not stuffed or otherwise prepared | 0 | 0 | 0 | 0 | 0 | 0 | 20,752 | 20,752 |
| Total | 0 | 252,390 | 14,864 | 76,013 | 95,980 | 10,169 | 2,543,253 | 2,992,671 |
(1) Agricultural industries; (2) Food processing industry; (3); Other manufactures and services; (4) Hotels and restaurants; (5) Households; (6) Stock Variation; (7) Exports
Source: Iarna/Banguat (2010)
Food production requires that we ensure water availability during the various growth stages of crops. Table 4 shows the different requirements of land and water for crops. Among uses of water it is important to distinguish between irrigated and rainfed agriculture. In the first case, producers must make sure that there is enough available water of quality for crops to grow. In the second case, producers depend on the availability of rain water, the hydrological cycle, and climate variability.
Table 4. Land and water use for crops (hectares and million cubic meters)
| (1) | (2) | (3) | (4) | (5) | (6) | (7) | (8) | |
|---|---|---|---|---|---|---|---|---|
| Coffee | 250,096 | 2,569.7 | 0.0 | 0.0 | 0.0 | 0.0 | 0.0 | 2,569.7 |
| Bananas | 63,585 | 535.8 | 341.1 | 0.0 | 477.5 | 79.6 | 898.2 | 1,434.0 |
| Maize | 825,424 | 4,819.4 | 0.0 | 0.0 | 0.0 | 0.0 | 0.0 | 4,819.4 |
| Palm oil tree | 100,000 | 1,360.7 | 627.3 | 47.1 | 734.0 | 106.1 | 1,514.5 | 2,875.2 |
| Beans | 354,092 | 931.6 | 0.0 | 0.0 | 0.0 | 0.0 | 0.0 | 931.6 |
| Sugar cane | 241,500 | 2,698.0 | 1,129.7 | 16.8 | 805.2 | 161.8 | 2,113.5 | 4,811.5 |
| All other crops | 1,236,786 | 2,267.9 | 589.0 | 204.7 | 399.4 | 240.4 | 1,433.5 | 3,701.3 |
| Total | 3,071,482 | 15,183 | 2,687 | 269 | 2,416 | 588 | 5,960 | 21,143 |
(1) Cultivated area (ha); (2) Rainfed water use (m3); (3) Aspersion (m3); (4) Drip irrigation (m3); (5) Other irrigation methods (m3); (6) Total irrigation (m3); (7) Total water use (rainfed + total irrigation) (m3)
Source: Iarna/Banguat (2010)
Maize production, as we’ve seen in terms of volume before, is highly important to Guatemalans. It represents also the largest water use among crops (4.8 million m3), which is comparable to that of sugar cane production. Nonetheless, the water used for the production of this crop comes exclusively from rain (rainfed agriculture). This is also the case for the production of beans, whose water use reaches 0.9 million m3.
Similarly, sugar cane has also a total water use of 4.8 million m3. This is, however, a more industrialized production which uses several methods of water provision: 56% rainfed, 24% aspersion, 17% gravity, and 3% other methods.
Other relevant uses of water correspond with palm oil tree production (2.9 million m3, 52% of which come from irrigation), coffee (2.6 million m3, all rainfed agriculture) and bananas (1.4 million m3, 63% of which comes from irrigation).
Table 5 shows the use of energy of various sources in Guatemala. It is interesting that agricultural production, which does use a certain amount of gasoline and diesel, only represents about 1% of total energy use in the country.
It is more relevant to note that households use about 40% of the country’s total energy use in the form of fuelwood. Judging by the 1% of total energy use that represent household gas or electricity use, it is implied that the main method of cooking in Guatemala is fuelwood.
Table 5. Energy use (Terajoules)
| (1) | (2) | (3) | (4) | (5) | (6) | (7) | (8) | (9) | (10) | (11) | Total | |
|---|---|---|---|---|---|---|---|---|---|---|---|---|
| Growing of coffee | 0 | 0 | 0 | 199 | 395 | 0 | 0 | 0 | 0 | 0 | 139 | 733 |
| Growing of bananas | 0 | 0 | 0 | 69 | 150 | 0 | 0 | 0 | 0 | 0 | 0 | 219 |
| Growing of cardamum | 0 | 0 | 0 | 70 | 46 | 0 | 0 | 0 | 0 | 0 | 0 | 116 |
| Growing of cereals | 0 | 0 | 0 | 163 | 1,067 | 0 | 0 | 0 | 0 | 0 | 0 | 1,230 |
| Grwoing of roots and tubers | 0 | 0 | 0 | 141 | 730 | 0 | 0 | 0 | 0 | 0 | 0 | 871 |
| Growing of fruits and nuts | 0 | 0 | 0 | 120 | 319 | 0 | 0 | 0 | 0 | 0 | 0 | 439 |
| Other crops | 0 | 0 | 0 | 60 | 159 | 0 | 0 | 0 | 0 | 0 | 0 | 219 |
| Cattle farming | 0 | 0 | 0 | 56 | 1,327 | 0 | 0 | 0 | 0 | 0 | 276 | 1,659 |
| Forestry | 0 | 0 | 0 | 130 | 890 | 0 | 0 | 0 | 0 | 0 | 0 | 1,019 |
| Fisheries | 0 | 0 | 0 | 74 | 103 | 0 | 0 | 0 | 0 | 0 | 0 | 177 |
| Manufactures, mining | 38,008 | 2,829 | 19,988 | 7,406 | 14,628 | 8,310 | 0 | 2,706 | 3,989 | 0 | 7,252 | 105,114 |
| Utilities | 0 | 0 | 13,856 | 97 | 1,927 | 13,634 | 828 | 0 | 1,608 | 40,980 | 1,242 | 74,173 |
| Other economic industries and services | 1,304 | 0 | 335 | 10,925 | 30,271 | 695 | 1,839 | 628 | 640 | 0 | 13,441 | 60,078 |
| Households | 208,070 | 0 | 0 | 22,808 | 2,366 | 0 | 706 | 6,945 | 132 | 0 | 6,649 | 247,676 |
| Exports | 0 | 21,656 | 0 | 0 | 0 | 0 | 0 | 0 | 0 | 0 | 474 | 22,129 |
| Stock variation | 0 | 918 | 0 | 2,099 | -1,405 | 1,163 | -73 | 4,281 | -2,246 | 0 | 0 | 4,737 |
| Total | 247,382 | 25,403 | 34,179 | 44,417 | 52,970 | 23,803 | 3,300 | 14,560 | 4,124 | 40,980 | 29,472 | 520,588 |
(1) Fuelwood; (2) Crude oil; (3) Coal; (4) Gasoline; (5) Gas oil (diesel); (6) Fuel oil and bunker; (7) Kerosene; (8) Liquefied petroleum gas; (9) Oil derivatives; (10) Bagass; (11) Electricity
Source: Iarna/Banguat (2010)
Statistical work on the use of fertilizers is at a very early stage in Guatemala and so it can be complicated to supply information in the format proposed by the SEEA AFF manual. However there are some estimations by FAO. For them:
“Fertilizer consumption measures the quantity of plant nutrients used per unit of arable land. Fertilizer products cover nitrogenous, potash, and phosphate fertilizers (including ground rock phosphate). Traditional nutrients–animal and plant manures–are not included. For the purpose of data dissemination, FAO has adopted the concept of a calendar year (January to December). Some countries compile fertilizer data on a calendar year basis, while others are on a split-year basis. Arable land includes land defined by the FAO as land under temporary crops (double-cropped areas are counted once), temporary meadows for mowing or for pasture, land under market or kitchen gardens, and land temporarily fallow. Land abandoned as a result of shifting cultivation is excluded.” (FAO 2016)
The figure below shows a time series of this indicator for the years 2002-2013. We see a growing trend, going from 189 kilograms per hectare in 2010 and reaching 256 kg/ha in 2013.
Figure 8. Fertilizer consumption (kilograms per hectare of arable land)
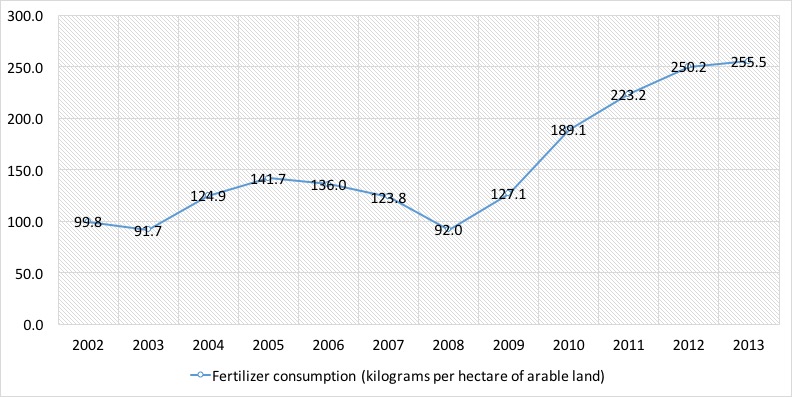 Figure 2. Fertilizer consumption (kilograms per hectare of arable land)
There is little data regarding nutrients and waste in the Guatemalan SEEA. However, there is a food balance sheet developed by the National Institute of Statistics for the year 2013, and even if it is impractical to reproduce it here, it is important to note that it has information on internal availability; losses and wastes; internal use; available food per year in metric tons; and supply of food and nutrients per inhabitant for:
Figure 3 shows the evolution of the availability of daily calories per capita from vegetal and animal sources. In the years 2005-2013 87% of Guatemalans’ caloric intake came from vegetal sources, and 13% from animal sources, in average.
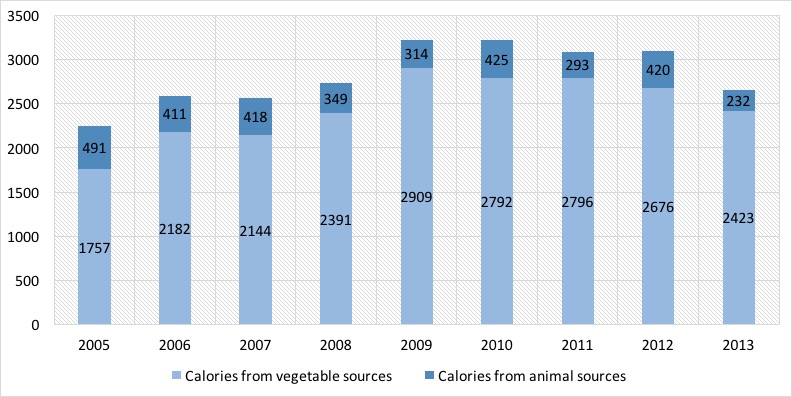 Figure 3. Total available calories
Table 6 shows the contribution of the different agricultural products to the Guatemalan economy in monetary terms for the year 2010. As we can see, the production of crops contributed around 9% of gross production, while cattle farming about 2%; the same as other agricultural products, forestry, and fisheries combined (2%). In total, all this production represents about 12% of the value added of the entire economy in that year.
Table 6. Total supply in monetary terms (thousands of quetzales)
| Output | Imports | Taxes less subsidies | Trade and transportation margins | Total | |
|---|---|---|---|---|---|
| Crops | 32,836 | 3,907 | 273 | 24,129 | 61,145 |
| Cattle farming products | 8,278 | 105 | 0 | 2,123 | 10,507 |
| Other agricultural products | 3,652 | 32 | 20 | 1,254 | 4,958 |
| Forestry | 3,551 | 67 | 1 | 2,782 | 6,401 |
| Fisheries | 882 | 95 | 7 | 491 | 1,474 |
| All other industries | 485,865 | 116,612 | 20,571 | -30,779 | 592,269 |
| Total | 535,063 | 120,819 | 20,872 | 0 | 676,754 |
Source: Iarna/Banguat (2010)
Table 7 shows the use of the same products in monetary terms. Households buy 59% of crops, 80% of other agricultural products, but only 19% of the production of cattle farming. For this last category, 80% is destined to intermediate consumption by other industries. As for fisheries, 42% of total output is bought by households, 37% becomes exports and 20% intermediate consumption.
Table 7. Total use in monetary terms (thousands of quetzales)
| Intermediate consumption | Exports | Households | Stock variation | Total | |
|---|---|---|---|---|---|
| Crops | 10,504 | 15,204 | 35,933 | -495 | 61,145 |
| Cattle farming products | 8,367 | 19 | 2,008 | 114 | 10,507 |
| Other agricultural products | 947 | 51 | 3,960 | -1 | 4,958 |
| Forestry | 1,408 | 2,060 | 2,864 | 69 | 6,401 |
| Fisheries | 299 | 544 | 624 | 6 | 1,474 |
| All other industries | 201,298 | 68,070 | 276,242 | 46,659 | 592,269 |
| Total | 222,823 | 85,948 | 321,631 | 46,352 | 676,754 |
Source: Iarna/Banguat (2010)
We now turn to extended production and income accounts for agricultural industries and the rest of the economy. Table 8 shows “taxes less subsidies” which represents monetary flows to the government in the form of taxes; net operating surplus, which is equivalent to profits from all companies; mixed income which is a mixture of self compensation and returns to capital of small business owners; compensation of employees; and value added, which is the total wealth generated by all economic activities in the accounting period.
Table 8. Extended production accounts (thousands of quetzales)
| Taxes less subsidies | Net operating surplus | Mixed income | Employee compensation | Value added | % of value added | |
|---|---|---|---|---|---|---|
| Growing of coffee | 3.2 | 1,256.9 | 2,442.8 | 1,015.3 | 4,718.2 | 1.5 |
| Growing of bananas | 2.4 | 2,276.7 | 17.3 | 444.9 | 2,741.3 | 0.9 |
| Growing of cardamum | 5.5 | 615.6 | 1,119.6 | 193.9 | 1,934.6 | 0.6 |
| Growing of cereals | 22.2 | 187.3 | 2,096.2 | 494.3 | 2,799.9 | 0.9 |
| Growing of roots and tubers | 4.6 | 397.0 | 6,498.9 | 838.9 | 7,739.4 | 2.5 |
| Growing of fruits and nuts | 5.6 | 1,588.6 | 1,547.8 | 312.3 | 3,454.2 | 1.1 |
| Other crops | 13.4 | 1,727.6 | 646.8 | 677.8 | 3,065.7 | 1.0 |
| Cattle farming | 2.7 | 2,526.1 | 3,499.0 | 1,213.0 | 7,240.7 | 2.3 |
| Forestry | 9.0 | 228.7 | 1,469.6 | 296.6 | 2,004.0 | 0.6 |
| Fisheries | 6.2 | 441.8 | 113.5 | 77.2 | 638.7 | 0.2 |
| Manufactures, mining | 600.6 | 33,562.0 | 20,898.5 | 28,267.5 | 83,328.6 | 26.7 |
| Utilities | 30.5 | 5,268.6 | 0.1 | 1,437.4 | 6,736.7 | 2.2 |
| Other economic industries and services | 1,331.8 | 86,318.6 | 32,511.5 | 65,676.2 | 185,838.1 | 59.5 |
| Total | 2,037.7 | 136,395.4 | 72,861.6 | 100,945.4 | 312,240.1 | 100.0 |
Source: Iarna/Banguat (2010)
We’ve seen how the information readily available from the System of Environmental and Economic Accounts of Guatemala can be used to implement an Agriculture, Forestry, and Fisheries account as proposed by FAO to a certain extent. While there are still a number of aspect that need to be covered by Guatemalan statistical efforts, some of the findings of this pilot implementation are already revealing.
For example, it was interesting to learn that maize production in Guatemala depends entirely on rain water for its growth. This exposes the production of this crop to considerable risk in terms of climate variability, which contrasts with the fact that after sugar cane and bananas, maize is the largest production in terms of volume.
A similar argument can be made of beans, which also depend entirely on rain water. Beans cover a relevant portion of the Guatemalan diet, and it is interesting to see how canned legumes are increasingly used by households. This form of consumption of beans is ever more present in urban kitchens and it might represent a cultural shift that might increase the importance of industrial food processing in the food chain.
It is also important to note the sheer amount of land used by maize and beans. Even if we have no land quality considerations in the data, the low yields of the lands used for these crops, coupled with lower levels of technical development and no irrigation provide an explanation to the considerable amounts of land used for their production.
A number of products that have local markets are shown to be destined to the export market in their entirety. This might represent a compilation or estimation error. That is the case of vegetable oil, margarine, animal foods, bread, other bakery products, unrefined sugar from sugar cane, and molasses. Findings such as this can help improve the SEEA Central Framework of Guatemala and even its National Accounts.
Finally, the most important finding regarding energy use is that while agricultural industries use negligible fractions of the total energy use of Guatemala (less than 1%), households do use about 40% of it in the form of fuelwood for cooking. Judging by the considerably less energy use of households in the form of liquefied gas and electricity, it is safe to imply that Guatemalan food is to a great extent cooked with fuelwood.