Fisheries and aquaculture
Environmental and economic accounting for fisheries
The total contribution of fish farming and aquaculture to GDP oscillated between 0.19% and 0.25% between 2001 and 2005, which is notably low in the Guatemalan economy.
The fisheries account of Guatemala is a framework that provides information on the link between fish stocks, both cultivated and not cultivated, and the economy. This work looked at data from the year 2001 through 2005. It links information on economic transactions and integrates it with the physical information on fish availabilities. In particular fisheries accounting:
Fish production in Guatemala is of an extractive nature, according to the data. In the accounting years, ocean and continental captures represented between 73% and 87% from the total supply of fish, leaving the remaining 13% to 27% to aquaculture, i.e. fish farming. The most relevant fluctuation happened in captures in the Pacific, which went from 26,459 metric tons in 2001 to 4,854 in 2005. There was an over all downward trend in output during the analysis years, with a significant drop in production to almost half from 2003 to 2004, with a slight recuperation in 2005 that is expected to continue.
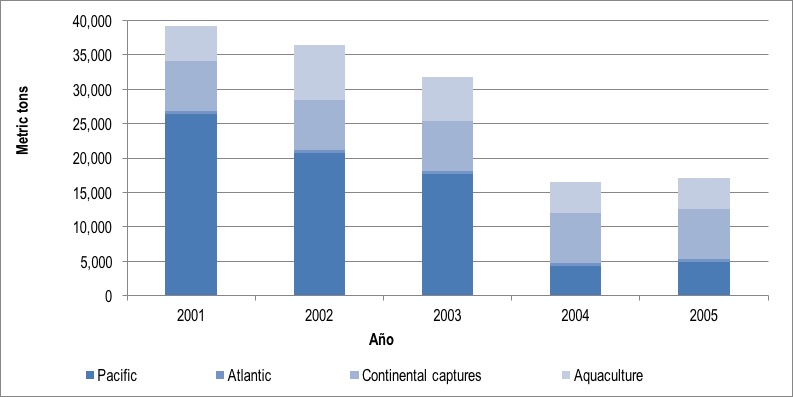 Figure 1. Total output from fisheries and aquaculture, 2001-2005 (metric tons)
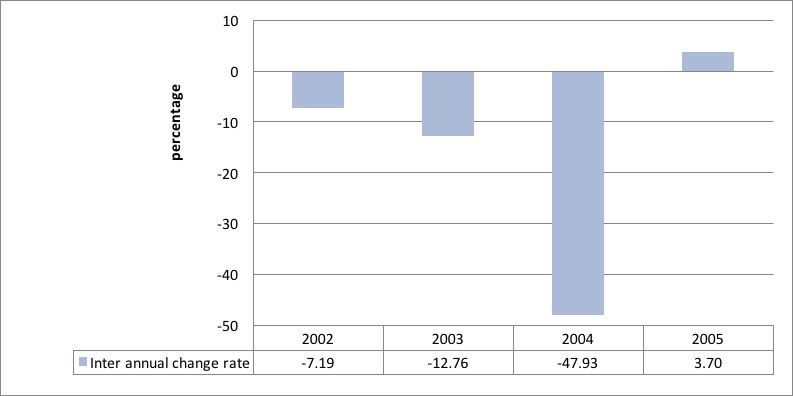 Figure 2. Inter annual change in output from fisheries and aquaculture, 2002-2005 (rate of change)
Geographically, fishing takes place in the Pacific coast, the Atlantic coast, and continental waters. We term the first two “marine fishing.” In terms of output, marine activities have been the most intense, mainly in the Pacific. As we saw earlier, there was a relevant drop, related to a drop in tuna extraction, which went from 23,528 metric tons in 2001 to 3,353 in 2005; an 85% drop. In turn, Atlantic coast fishing and continental fishing remained stable with annual extractions between 345 and 485 metric tons in the first case, and of 7,300 metric tons in the second case.
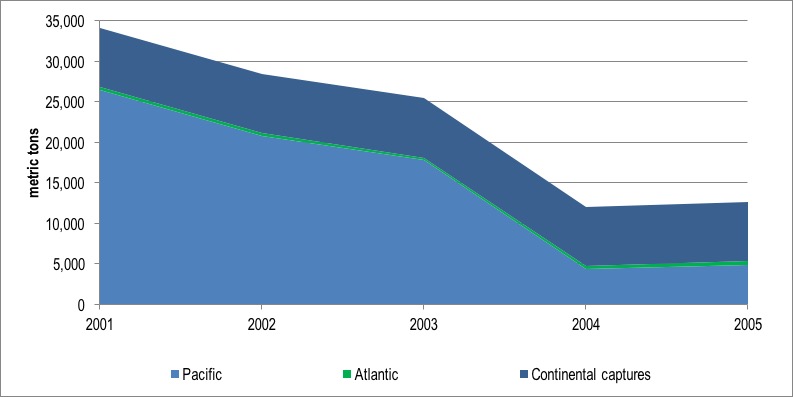 Figure 3. Fisheries output by geographic area, 2001-2005 (metric tons)
Pacific coast fishing is dominated by tuna fish and shrimp extraction to the point that these two species have reached 94% of all output in 2002. However, there have been other species that were captured as well. For example, from in 2004-05 there was a spike in the production of demersals, sharks, rays, and chimeras.
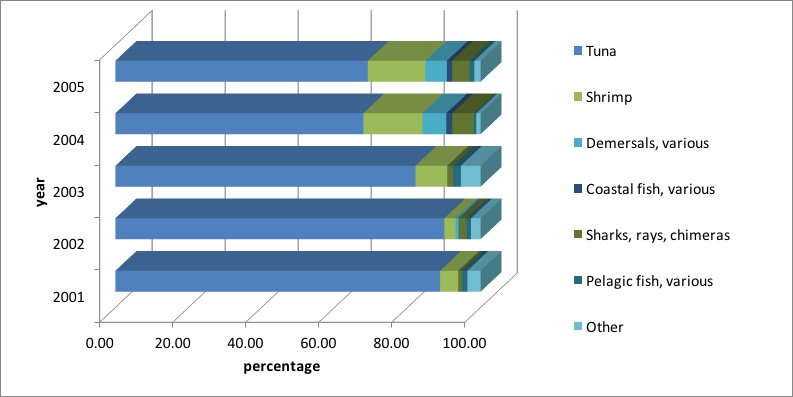 Figure 4. Captures in the Pacific coast by species, 2001-2005 (percentage from total production)
In some Central American countries, like Belice and Honduras, aquaculture or fish farming represents upwards of 80% of the entire fish output. This is not the case in Guatemala, where fish farming contributed between 13% and 27% of annual output in the years 2001-2005. From this industry, fresh water shrimp (between 49% and 87% of their output) and tilapias (between 13% and 47% of total output) were most relevant.
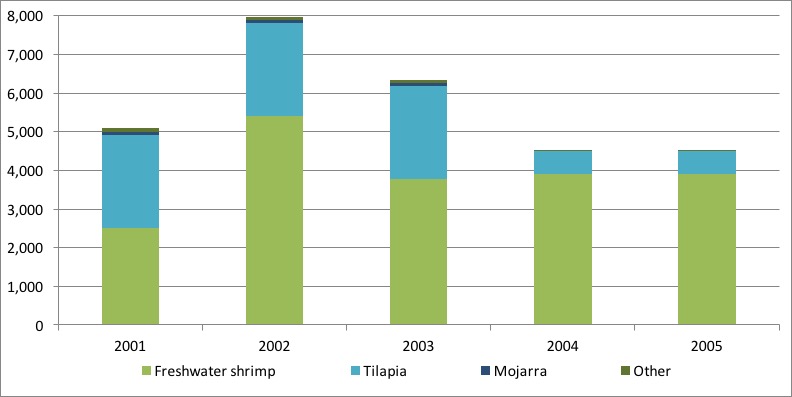 Figure 5. Aquaculture by species, 2001-2005 (metric tons)
Data reveals that fish farming occurs in most departments (largest administrative geographical area) of Guatemala. Nevertheless, it is in Escuintla that most surface area is devoted to this industry, with about 324 hectares, or 73% of the entire country’s aquaculture land. Retalhuleu is also relevant with a share of 9%, and Jalapa and Suchitepéquez with 4% and 3%, respectively. The rest of the country takes up the remaining 11%.
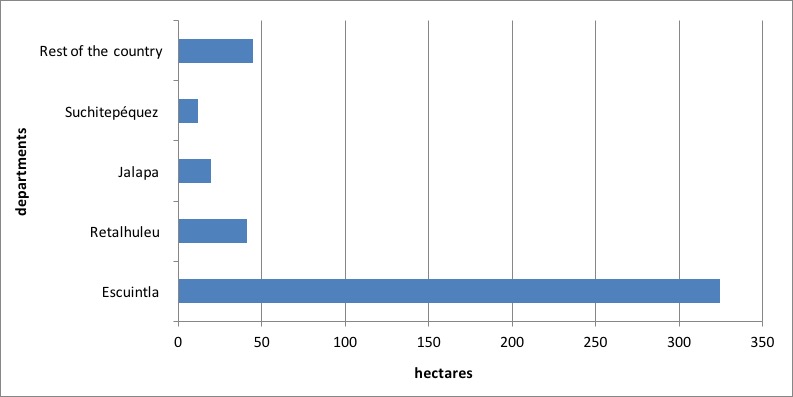 Figure 6. Surface area devoted to fish farming by department, 2003 (hectares)
Shrimp is a product that is mainly produced in the departments adjacent to the Pacific coast. A relevant 99% of the surface area destined to this type of production concentrates in Escuintla, Retalhuleu, and Suchitepéquez. The remaining 1% is spread over the rest of the departments. Fish farming is more evenly distributed, with 33% of the surface in the East (Jalapa and Jutiapa), 29% in the South (Escuintla, Santa Rosa, and Suchitepéquez), 9% in Izabal to the Northeast, and 29% in the rest of departments.
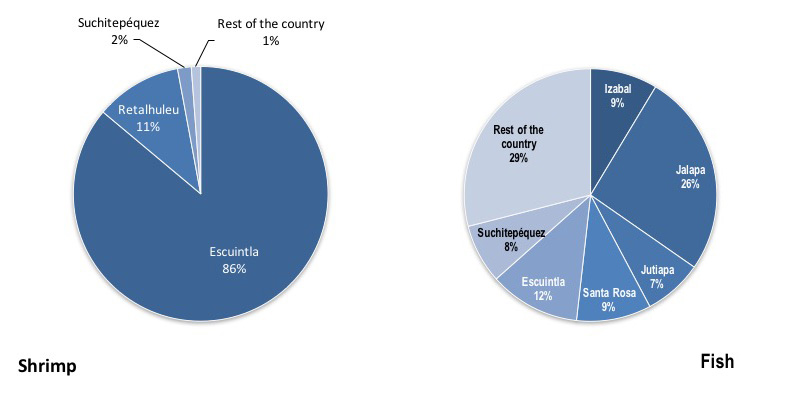 Figure 7. Distribution of surface area destined to shrimp and fish farming in Guatemala, 2003 (percentage)
In monetary terms, fisheries and aquaculture contribution to the economy had a downward trend. The drop in physical volumes observed in the analysis years was dampened in monetary terms due to an increase in the price of products from these industries. In 2001, output from fisheries and aquaculture was valued at GTQ 894.4 million, while in 2005 this reached GTQ 740 million, equivalent to an 18% reduction. In those same years there was a drop in output of 66%. In other words, a metric ton of output was valued at GTQ 22,907 in 2001, and at GTQ 43,174 in 2005.
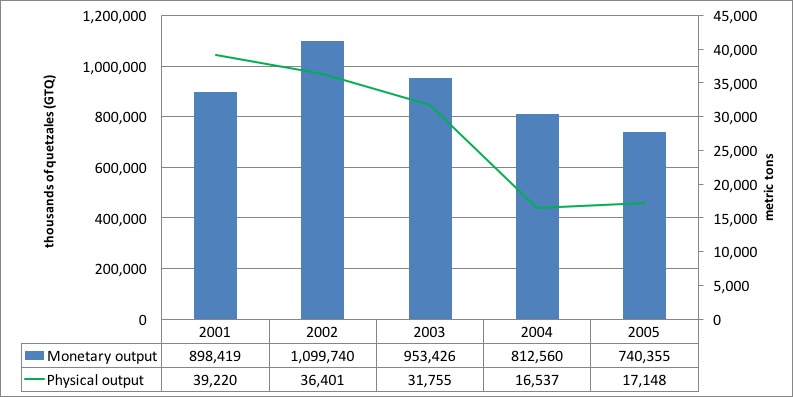 Figure 8. Total output from fisheries and aquaculture (metric tons and thousands of quetzales—GTQ)
The total contribution of fish farming and aquaculture to GDP oscillated between 0.19% and 0.25% between 2001 and 2005, which is notably low in the Guatemalan economy. The industries linked to fisheries and aquaculture generated value added in the order of GTQ 289 million in 2001 and GTQ 418 million in 2004.
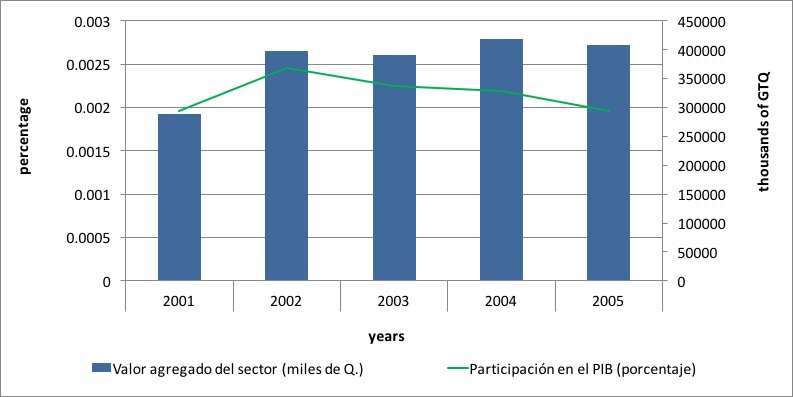 Figure 9. Value added and contribution to GDP from fisheries and aquaculture, 2001-2005 (percentages)
In terms of use of products from these industries, evidently households took up the largest share, which represented 54% in 2005. Exports were responsible for 22% of total use, and the food processing industries used 17% as inputs for their production. The remaining 7% became stock variation.
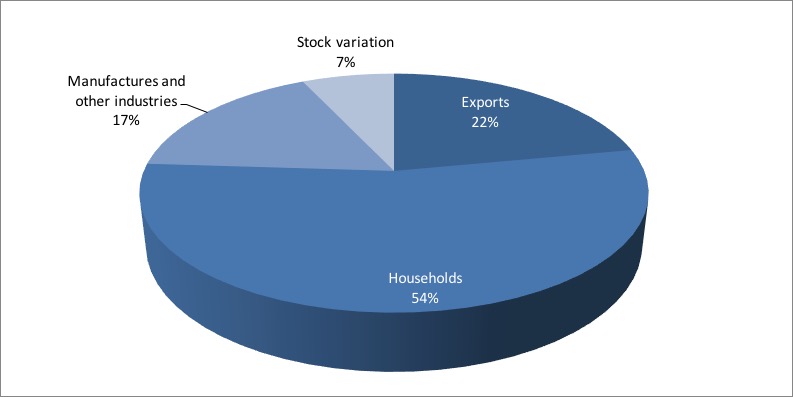 Figure 10. Use of products from fisheries and aquaculture, 2005 (percentages)
Those animals that are caught alongside the target species are usually discarded back into the oceans. This is added to the fraction of the target species that is also discarded for economic or other reasons. The volume of discarded material depends in the different fishing gears. In the case of Guatemala, shrimp and tuna captures were responsible for between 3,387 and 8,924 metric tons of discards in the years 2001-2005. Of the total discarded volume, these values represented between 79% and 95% in the analysis years.
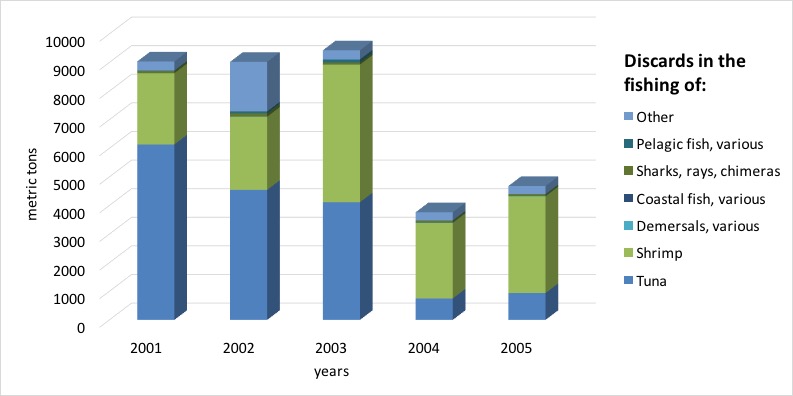 Figure 11. Discards of marine fishing, 2001-2005 (metric tons)
In this essay we presented the fisheries and aquaculture account of Guatemala as a framework that provides information on the link between fish stocks, both cultivated and not cultivated, and the economy. It is interesting to note that: