Forests
Tracking the economic causes of deforestation
Forest accounting revealed that over 95% of deforestation happened outside of the control of government institutions and that the use of fuelwood has a higher impact on forests than previously thought.
The forest account of Guatemala is a framework that explains the relationship between forests and the economy. It puts together information on the status of forests and economic transactions associated with them in a systematic manner. It reveals the real contribution of forests to the national economy and the possible impacts that the economy might have on the well-being of forests.
More specifically forest accounting measures the stocks of the national forest inventory and the flows associated with it; it identifies the industries and stakeholders that benefit directly or indirectly from forests; it records expenditures made by government institutions in order to mitigate damages to and restore the well-being of forests; and extend macro-economic aggregates and indicators in order to reflect the depreciation of the forest resources.
In order to answer this question we turn to the change of forest land stock in comparison with 1970 and to an indicator of this change relative to population (forest land stock per capita). As for changes in land stock, by 2005 Guatemala had lost close to 40% of its 1970 availability. More illustrative is the fact that due to high population growth rates, availability of forests per capita have dropped in a relevant way.
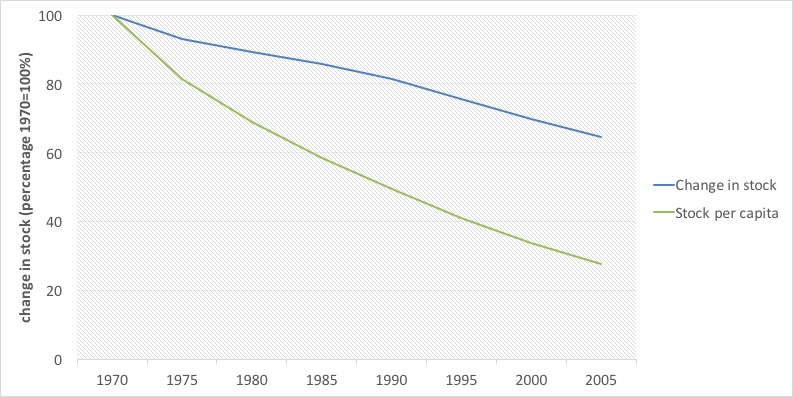 Figure 1. Land stock change from 1970 to 2005 (percentages, 1970=100)
Another important indicator is the rate of deforestation, which helps to measure the impacts of government policies on sustainable resource use. In the case of Guatemala, absolute deforestation rates are stable between 60,000 and 70,000 hectares per year. This represents an annual stock loss of about 1.5% per year. The highest since 1950, and even greater than 1970s records, when population reallocation policies pushed for aggressive changes of forest land into agricultural land. That rate seems high when put in context with others from Latin America from the 1990-2000 decade, such as Brazil (0.4%), Bolivia (0.3%), Colombia (0.4%), Ecuador (1.2%), and Mexico (1.4%).
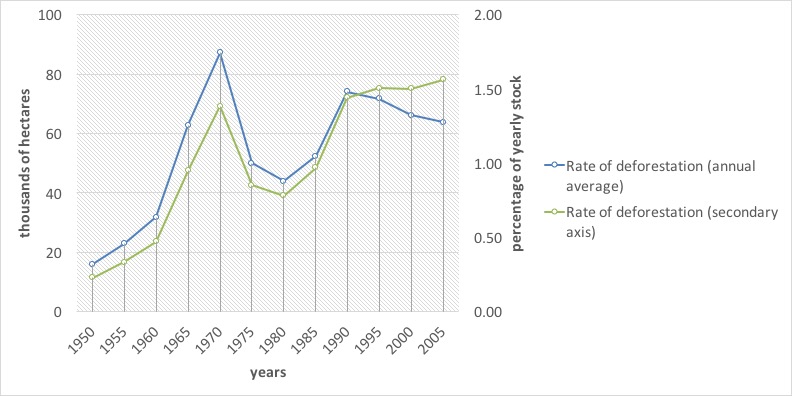 Figure 2. Deforestation rates 1950-2005 (thousands of hectares and percentages of stock relative to the previous year)
There are other causes of reduction of forest volume, such as timber and fuelwood selective extraction, de-branching, forest fires, plagues and diseases, as well as natural mortality. Uncontrolled logging and selective fuelwood extraction is one of the main reasons for forest volume reduction. By forest account estimates more than 95% of forest product flows in the country (30.7 million m3) happen outside the control of the forest government authorities (National Institute of Forests—INAB—and the National Council for Protected Areas—CONAP—). Forest accounting estimates attribute 76% of that uncontrolled forest use to fuelwood extraction and 24% to timber extraction. Up to two thirds of all timber processed by wood processing industries is estimated to come from uncontrolled sources.
The rise uncontrolled traffic of forest products is consistent with (i) a lack of institutional capabilities for control, (ii) an ineffective control system for the transportation of forest products, (iii) the lack of an effective transportation permit issuing system, (iv) obscure market practices that operate under the legal umbrella of family forest allowances, and (v) a lack of raw materials origin control within the wood processing industries.
The forest account assigned market valuations to standing timber between 2001-2006. In that period the value of forests went from 56,351.9 million quetzales (GTQ) to 83,467 million. This is a behavior more consistent with non-renewables than with renewable resources and hints that forests might be used unsustainably. Under sustainable practices, forest regeneration should provide constant availability at stable prices.
Even when valuating at constant prices of 2001, monetary values of forests increased in spite of the reduction of the forest stock, which was close to 76 million m3 between 2001 and 2006.
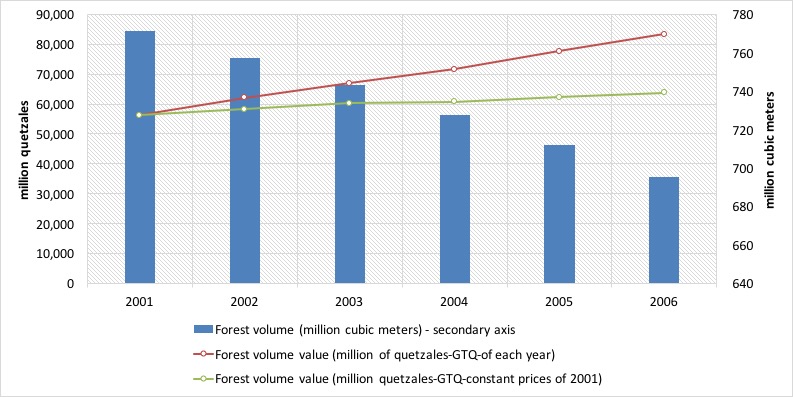 Figure 3. Forest volume and monetary value of forest assets for the years 2001-2006 (cubic meters and valuation at constant prices of 2001)
If we contrast forest growth with reduction due to either controlled or uncontrolled logging, it is easy to see that the former does not compensate for the latter. In 2006, for example, that resulted in the loss (or net stock variation) of GTQ2,076 million. On the other hand, uncontrolled logging represented more than GTQ2 billion, which exceeds the value of controlled logging by far.
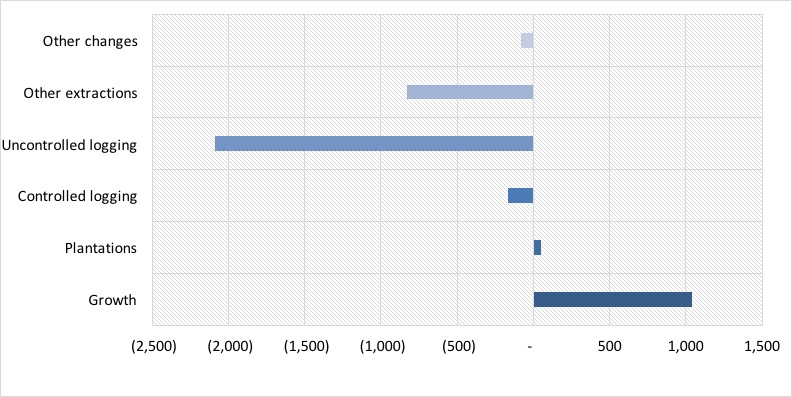 Figure 4. Forest stock variation in monetary terms for the year 2006 (million GTQ)
In terms of volume, households are the largest users of forest products, using 22.6 million m3, which represented about 67% of total national consumption. Most of that use (92%) corresponded to fuelwood use. The remainder is mostly used by the saw mill industry and the production of furniture.
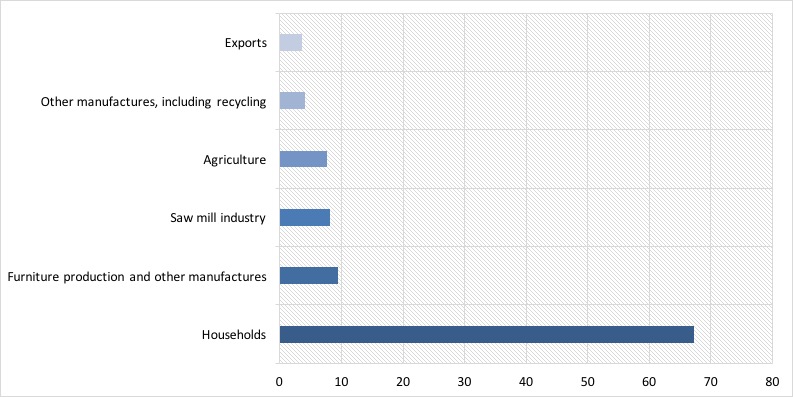 Figure 5. Main users of forest goods in Guatemala in 2006 (percentages)
On the other hand we have total supply of forest products in monetary terms. Primary output contributes 34% of total supply of wood products, with a strong component of logging products and fuelwood.
Historically, non-wood products have contributed less to total supply and in 2006 they represented about a billion GTQ. In spite of the touted idea that non-wood products represent a high potential, in Guatemala this market is still small.
Secondary output, consisting of sawn wood and furniture is responsible for the largest numbers in total supply. In 2006, their value reached GTQ 8.2 billion, corresponding to a little over 40% of total supply of forest products.
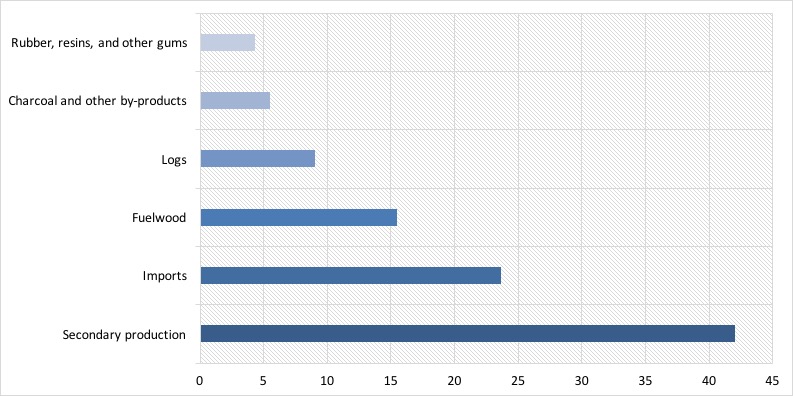 Figure 6. Supply of forest products in 2006 (percentages)
Demand of primary output of forest products (wood products, non-wood products, wild animals and their products) is linked to final household consumption. Intermediate consumption or that used as inputs by other industries, represents about 40%, and exports 12% of total use. These numbers are highly influenced by the use of fuelwood as a source of energy and by a small forest industry with little incidence in exports.
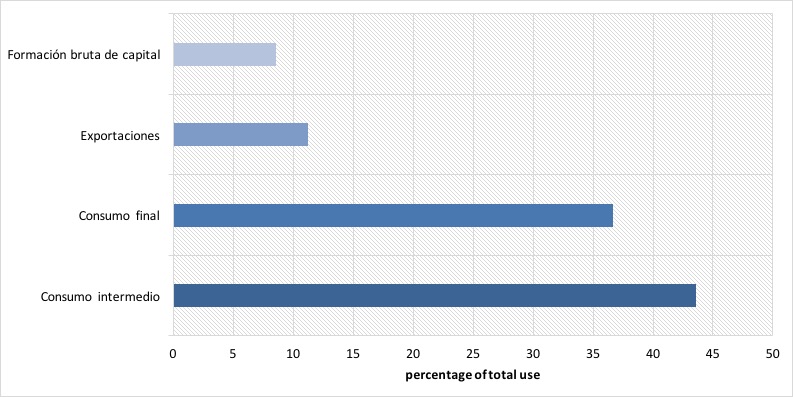 Figure 7. Demand of forest products in 2006 (percentages of total use at purchaser prices)
One important finding of the forest account is that the real contribution of forest products to the national economy circles around 3.15% and 2.57% for the years 2001 and 2006, respectively; while normal GDP measures attribute only contributions of 1.02% and 0.93% in the same years, respectively.
Another important finding is that the value of resource exhaustion (or its depreciation) is equivalent to 0.9% of GDP for the year 2006. What this implies is that if we take into account the forestry sector by itself, total contribution to the economy would be zero in practical terms.
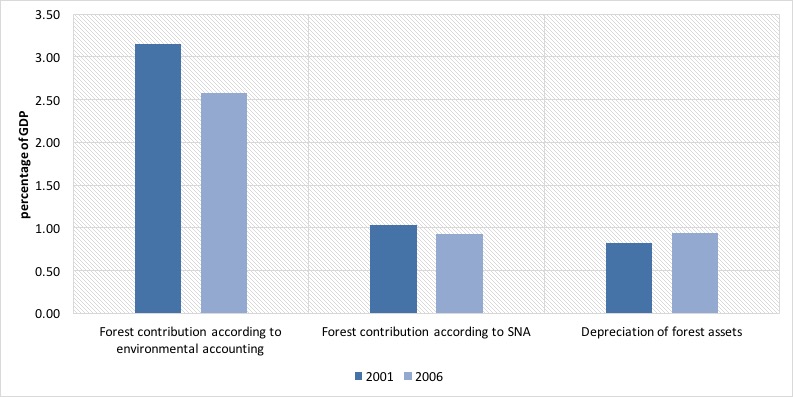 Figure 8. Contribution of forests to the economy in 2001 and 2006 (percentages)
When adjusting GDP for the depreciation of forests, we see only a small reduction of about 1%, which is evidence of a small over-estimation of the true performance of the economy. This could be larger if unsustainable use of other natural resources were included in this calculation.
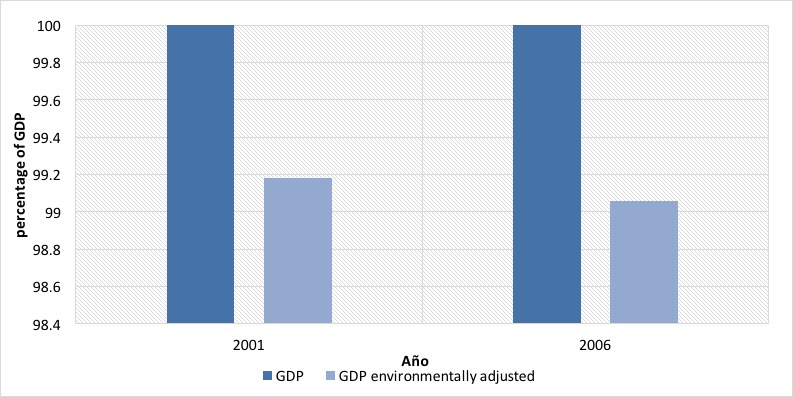 Figure 9. GDP adjusted for the depreciation of forests in 2001 and 2006 (percentages)
When comparing the direct value of depreciation of forests with public investments which are destined to the protection and regeneration of forests it is evident that they are insufficient to cover the depreciation that we discussed earlier; i.e. the Budget of the National Institute of Forests—INAB—, including the National Forest Incentives Program, and the National Council for Protected Areas—CONAP—. Forest management expenditures (current and capital expenditure) represent only about 10% of the depreciation.
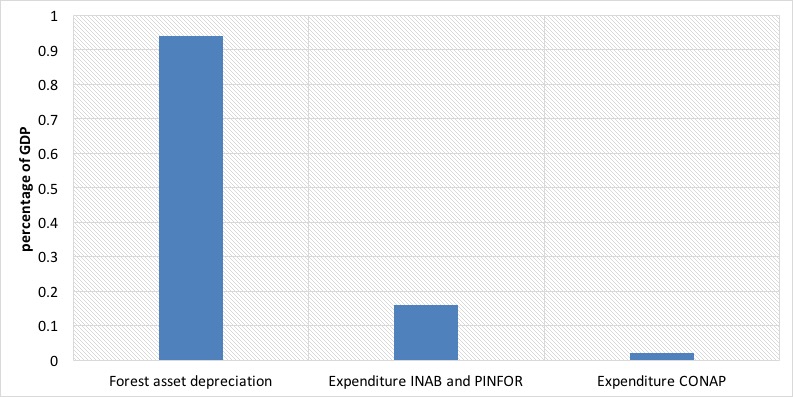 Figure 10. Comparison between depreciation of forest resources and forest protection expenditure in 2006 (percentages)
We have introduced the forest account of Guatemala; a framework that explains the relationship between forests and the economy, bringing together information in order to reveal the real contribution of forests to the national economy and the possible impacts that the economy might have on the well-being of forests. Some of the most important findings include:
| Name | Type | Link |
|---|---|---|
| Forest account tables in cubic meters 2001-2001 (In Spanish) | xlsx | Download |
| Forest account tables in metric tons 2001-2001 (In Spanish) | xlsx | Download |
| CIB Folleto Informativo (In Spanish) | Download | |
| CIB Resultados y Análisis (In Spanish) | Download | |
| CIB Bases teóricas (In Spanish) | Download |