Subsoil
Valuing what lies beneath the surface
The industries related to subsoil resources contributed between 1.94% and 2.34% of GDP annually in the analyzed years, specially owing to the non-metallic minerals extraction industry. Conversely, oil extraction was the largest use of these resources in physical terms.
The subsoil resources account of Guatemala is a framework that provides information on the availability of stocks of these resources and how they are used by the economy. It links information on economic transactions and integrates it with the physical information on subsoil resource flows. In particular subsoil resources accounting:
Between 2001 and 2006, the Guatemalan economy extracted 284 million metric tons of subsoil assets from the ground, of which 54% (152 million metric tons) were hydrocarbons. About 45% of the total was non-metallic minerals, which are used mainly by the construction industry and some manufacturing processes. The remaining 1% corresponded roughly to metallic minerals.
Midway during the analysis period both hydrocarbon and non-metallic mineral extraction changed their growing trend and started a contraction phase. This happened after 2003 in the first case, and from 2004 onwards for the second. By 2006 hydrocarbon extraction represented about 65% of the highest level it had reached three years earlier. Non-metallic minerals saw a 29% reduction, in comparison to the levels of 2003. Metallic minerals showed no defined tendency.
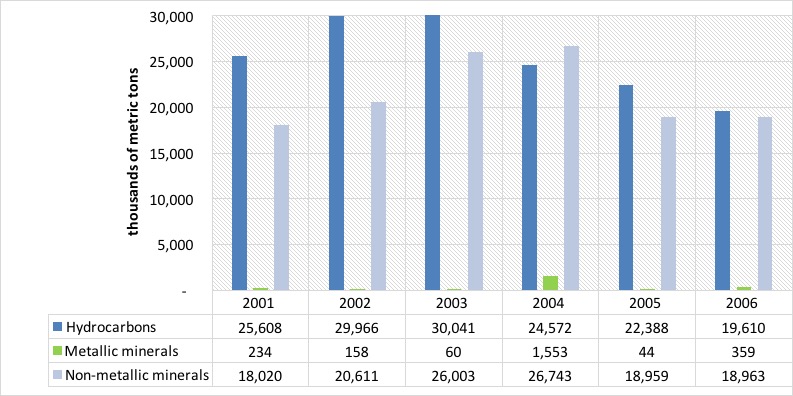 Figure 1. Subsoil resource extraction by type of asset (metric tons)
Subsoil resources stocks vary negatively as a result from extraction and positively when new discoveries are made. In the case of Guatemala, extractions usually surpass new discoveries so we can see a general downward trend of these stocks. Hydrocarbons, for example, saw a 5% reduction in their availability as a result of extraction, going from 2,861 million metric tons in 2001 to 2,729 in 2006. Non-metallic and metallic minerals saw a 1% reduction by 2006, compared to their stocks in 2001.
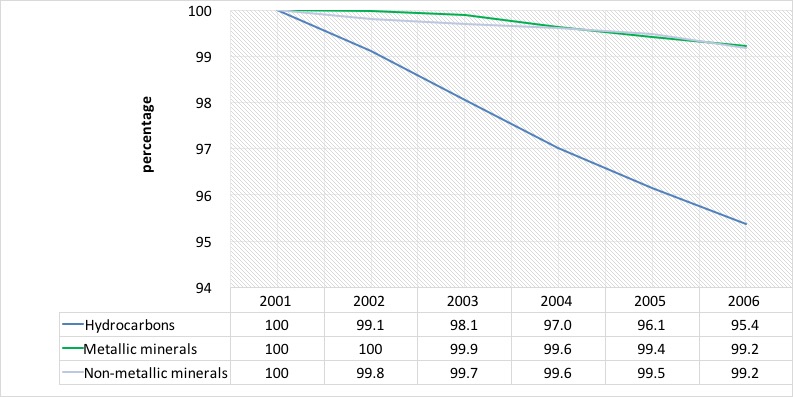 Figure 2. Yearly opening stocks of subsoil resources (percentages 2001= 100%)
The supply of subsoil resources is overwhelmingly dominated by hydrocarbons and non-metallic minerals in comparison with metallic minerals. In the case of hydrocarbons, total supply varied between 19,623 and 30,856 thousands of metric tons annually between 2001 and 2006. This was equivalent to 42% and 59% of total supply, respectively. Non-metallic minerals shows a similar performance. In some years, the supply of these minerals has surpassed that of hydrocarbons, reaching 50% of total subsoil resources supply. Physical supply of metallic minerals has been considerably lower to that of the other two groups. In our analysis years, its relative importance oscillated between 0.2% and 5.8% of total supply.
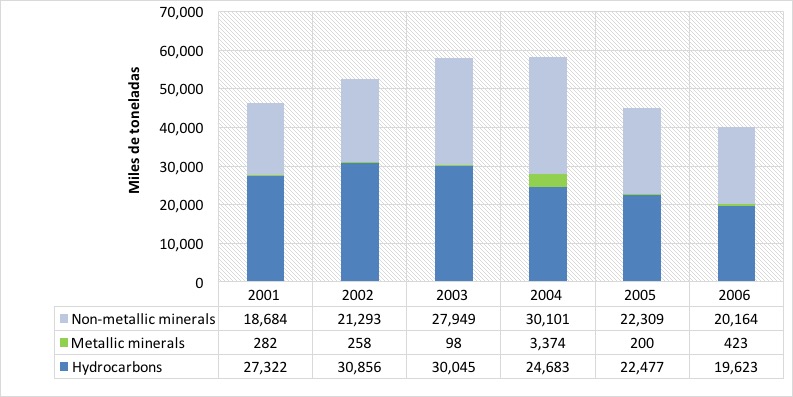 Figure 3. Physical supply of subsoil resources (thousands of metric tons)
Total supply has a locally produced component and an imported one. For hydrocarbons and non-metallic minerals the imported portion is not relevant. However, in the case of metallic minerals, imports reached as much as 78% of total supply in 2005 and 48% in the entire period. In contrast, hydrocarbons and non-metallic minerals imported 2% and 8% of total supply from 2001 to 2006, respectively.
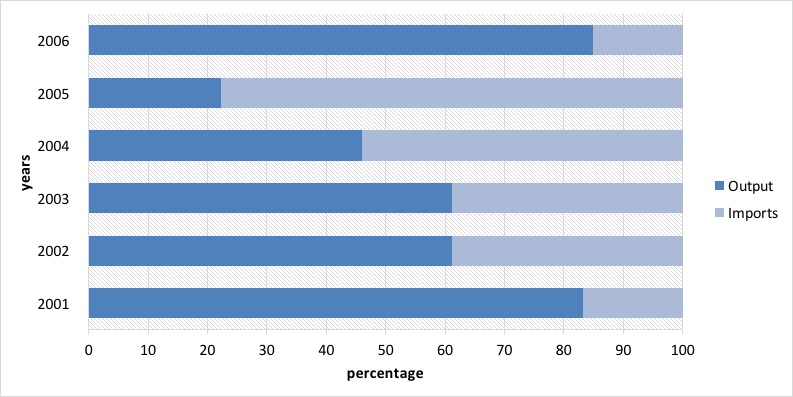 Figure 4. Output vs import of metallic minerals, 2001-2006 (thousands of metric tons)
Subsoil resources are mostly used as inputs in industrial processes, both from local companies, as well as from abroad. Households consumed between 217 and 354 thousands of metric tons annually in our analysis years. That was equivalent to less than 1% of total supply in any year, which consists of up to 99% of resources for construction processes, such as limestone. In contrast, their use as exports and as inputs in other industries, which we term “intermediate consumption”, reached between 73% and 84% of total use in the analysis period.
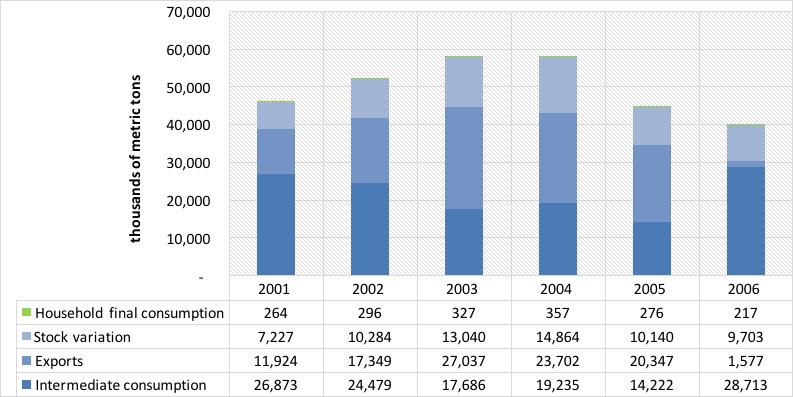 Figure 5. Subsoil resource use between 2001 and 2006 (thousands of metric tons)
When we analyze the above mentioned intermediate consumption, or the use of products as inputs in production processes of other industries, it is possible to dig deeper and disaggregate the industries that are the largest users of these resources. In the case of these products, there are six industries out of the 123 identified in the Guatemalan economy that represent 93% of total demand. The remaining industries used about 9 million metric tons of subsoil resources, or about 8% of total intermediate consumption. We group the most important six in three groups:
We analyze the value of subsoil resources from the perspective of the valuation of their stocks. When comparing opening stocks, we see a 134 million metric tons reduction from 2001 to 2006, or about 4% of the total. The biggest reduction occurred in hydrocarbons. But the value of that stock might change because of market circumstances and it might fluctuate even if physical stocks remain the same. We see one such revaluation of Guatemala’s stocks in the accounting period.
In the case of hydrocarbons, for example, the opening stock valuation rose from 179,679 million quetzales (GTQ) in 2001 to GTQ 491,336 million, in spite of stock reductions and not attributable to inflation. This situation is explained by a rising trend in international oil prices. Non-metallic minerals, there was a relevant change in valuation from the opening stock of 2004, which was valued at GTQ 23,477 million, to the opening stock of 2006, valued at GTQ 60,949 million. A similar situation occurred with metallic minerals, but in a more discrete manner.
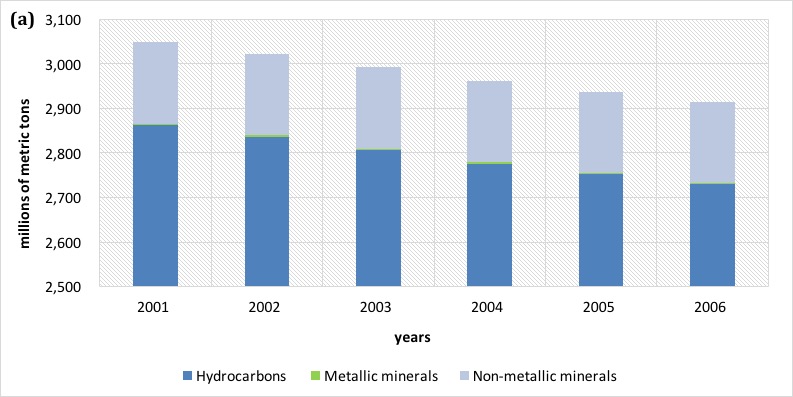
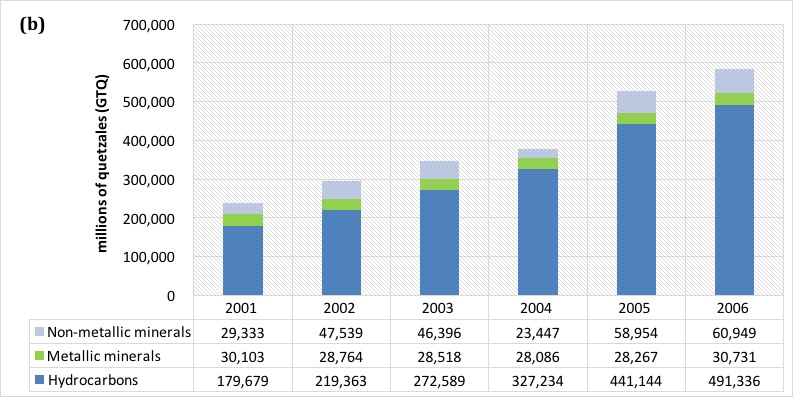 Figure 6. Opening stock performance a) physical and b) monetary (million metric tons and million GTQ)
In Guatemala, from 2001 to 2006 there was a flow of subsoil resources ranging between GTQ 3,392 million and GTQ 5,014 million, at each year’s prices. During the analysis years, industries related these resources increased their contribution to the Guatemalan economy by 90%, going from GTQ 2,852 million in 2001 to about GTQ 5,427 million in 2006. Full time equivalent jobs went from 64,236 to 87,025 annually in the same years. Over 40,000 of these jobs were generated in the non-metallic minerals extraction industry. In the case of exports, there is a clear jump from 2005 to 2006 due to the beginning of operations in gold mining from GTQ 1,835 million to GTQ2,768 million. But from all subsoil resources, oil production represented 66% of the value of exports in 2006, while gold and silver represented 27% and 5%, respectively.
All industries related to subsoil resources contributed between 1.94% and 2.34% of GDP annually in the analysis years. From these, the largest value corresponds to products from non-metallic minerals, which averaged 1.05% of GDP. Oil extraction showed the most dynamic performance, going from 0.27% of GDP in 2001 to 0.65% in 2006; an annual average of 0.53% in all six years. The remaining industries represented about 0.20% of GDP annually.
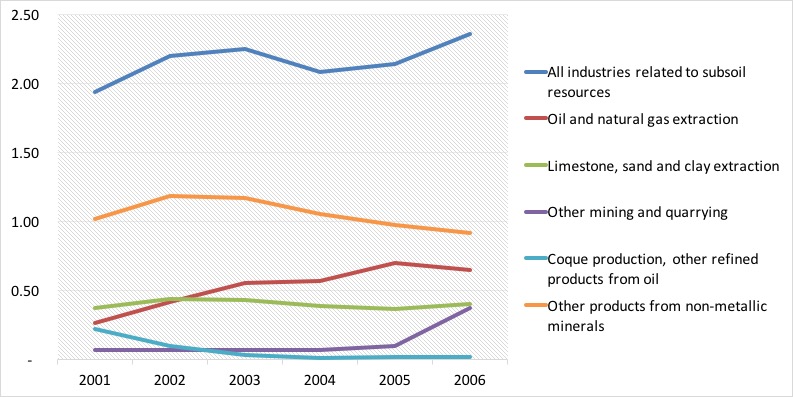 Figure 7. Industries related to subsoil resources and their contribution to wealth (percentage of GDP)
In this essay we introduced environmental and economic accounting of subsoil resources as a framework that provides information on the availability of stocks of these resources and how they are used by the economy. Some interesting findings of this exercise reveal that: