Land and Ecosystems
An ecologically diverse nation
Natural capital accounting revealed that out of fourteen ecosystem regions in Guatemala, nine are severely fragmented to a point where their integrity and the provision of natural goods and services can no longer be guaranteed.
The Land and Ecosystems account is a framework that determines the current status of the different eco-regions of Guatemala in physical terms and quantifies the rate of their use through an analysis of land use change and its effects on forest cover. Furthermore, it identifies the economic stakeholders that drive those changes.
Eco-regions are relatively large portions of the local landscape that hold specific arrangements of natural resources and species with limits that are close to the original extension of those arrangements prior to human intervention. In Guatemala, there are 14 of these regions and two of them represent 71% of the country’s area. These are Rainforests of Petén-Veracruz (44%) and Pine-Oak forests of Central América (27%).
Table 1. Eco-regions of Guatemala (percentage of country area)
| Eco-region | Area |
|---|---|
| Rainforests of Petén-Veracruz | 44.20% |
| Pine-Oak Forests of Central America | 27.10% |
| Rainforests of the Central American Atlantic | 7.20% |
| Dry Forests of Central America | 6.10% |
| Bosques montanos de Centroamérica | 5.50% |
| Rainforests of the Chiapas Sierra Madre | 5.10% |
| Motagua Valley Arbustal Espinoso | 2.20% |
| Tehuantepec-El Manchón Mangroves | 0.80% |
| Dry Forest of the Chiapas Depression | 0.80% |
| Belicean Cost Mangroves | 0.30% |
| Bosques montanos de Chiapas | 0.20% |
| Pacific Coast Dry North Mangroves | 0.20% |
| Rainforests of Yucatán | 0.10% |
| Northern Honduras Dry Mangroves | 0.01% |
Source: Iarna/Banguat (2010)
Forest cover reached 4.2 million hectares in 2003, which was about 39% of the country’s area. Conversely, land used for agriculture represented about 28% of the territory, and a combination of pastures, grasslands, shrubs and bushes took up about 31%. The distribution of the different land uses within the eco-regions was highly irregular, and it is noteworthy that over 30% of the total area was destined for perennial and annual crops in 7 of the 14 regions.
There are large differences between regions. For example, the Yucatán Rainforest region had a forest cover of almost 78% in 2003, while the Dry forests of Central America had only about a 2% forest cover. Only five of the regions had a forest cover larger than the national mean, which revolved around 39%. These were the Rainforests of Petén-Veracruz (55%), the Rainforests of Yucatán (78%), Bosques montanos de Centroamérica (42%), Belicean Cost Mangroves (60%), and Northern Honduras Dry Mangroves (50%).
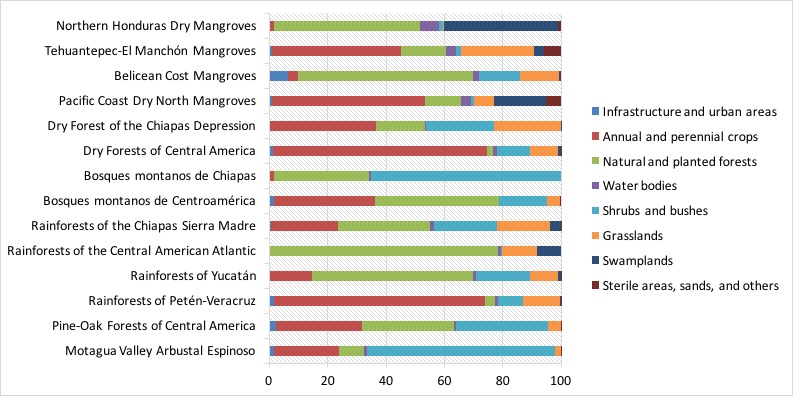 Figure 3. Land use in Eco-regions of Guatemala (2003)
The area with more agricultural activity in detriment of the forest cover is the Pacific Basin. There are 1.48 million hectares under cultivation. This is 61% of its surface area and almost half of all agricultural land in the country (49.4%). Its forest cover represents only 12% of its area. In contrast, the Gulf of Mexico Basin has a forest cover of 49% of its surface area (about 2.5 million hectares of forests).
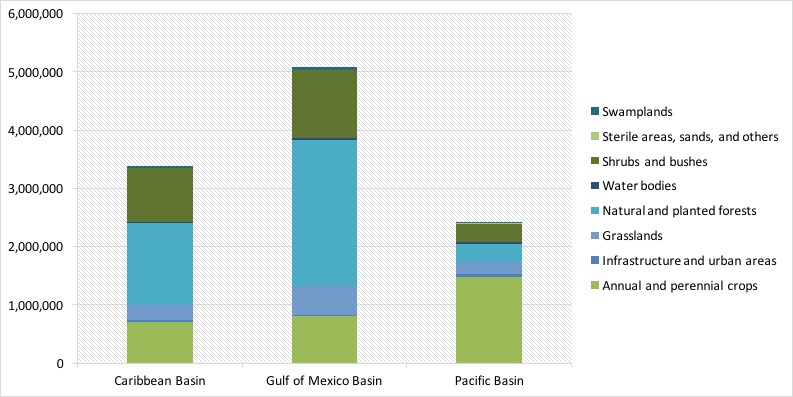 Figure 4. Land use in Guatemala by Basin (2003)
In addition to understanding the current forest cover of a territory, it is illustrative to see how the forest has degraded over a certain period. In order to achieve this, we compare and contrast maps of forest cover built from satellite images. These maps require the work of several technicians from several institutions working together, and for this reason these maps are only published every few years. At the time of this comparison, only maps from 1991 and 2003 were available.
Guatemala lost 880,220 hectares of forest cover between 1991 and 2003, which represented a rate of deforestation of 17.3% for the analysis years, relative to the forest cover in the first year. The main affected areas were the Rainforests of Petén-Veracruz with 540,215 hectares of forest cover lost, and the Pine-Oak Forests of Central America with 192,628 hectares. These regions accounted for 82% of all deforestation in those years. However, the Dry Forests of Central America region saw a most alarming rate of deforestation of 44%. At that pace, forest cover in that region could not last more than 20 years.
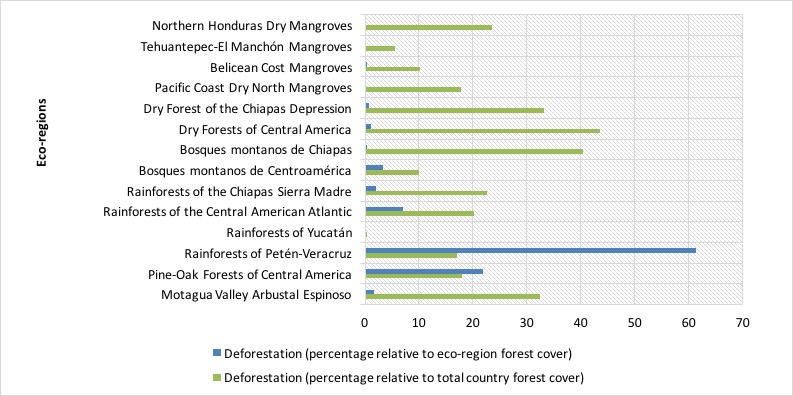 Figure 5. Evolution of deforestation in Guatemala’s eco-regions between 1991 and 2003
Evaluating the health of an ecosystem is a difficult task given the complexities of natural interactions. Nevertheless, there were indicators that we could use as proxies for ecosystem well-being. In that sense we evaluated forest density, forest fragmentation, and ecological integrity.
Forest density measures spatially the existence of forest cover in every square kilometer. The more dense a forest, the better its ecological integrity. The data showed that Guatemala’s more dense forests–especially those with densities higher than 60%–, lost relevant portions of forest cover. The Gulf of Mexico Basin shows the most losses, with reductions of over 20%. Those area categories with no forest cover and those with densities lower than 40% showed increases of over 20%.
Forest fragmentation measure the size of continuous blocks of forests and classifies them in 5 size categories. Between 1991 and 2001 four blocks of the larger categories (50,000 to 150,000 hectares) disappeared in the North of Guatemala, resulting in isolated areas of the 10,000 to 50,000 size category. In the South of the country, fragments were determined to be of the 0.5 to 2,000 hectare size predominantly.
Ecological integrity is a measure that we were able to infer from the two measures previously explained. This showed that nine out of fourteen eco-regions do not possess the minimum connectivity and fragment size required to guarantee the provision of environmental services.
The eco-regions with less than 10% forest cover showed the most ecological integrity problems, all of them located in the Pacific Basin. These were the Dry Forests of Central America, RaiRainforests of the Chiapas Sierra Madre and the Pacific Coast Dry North Mangroves.
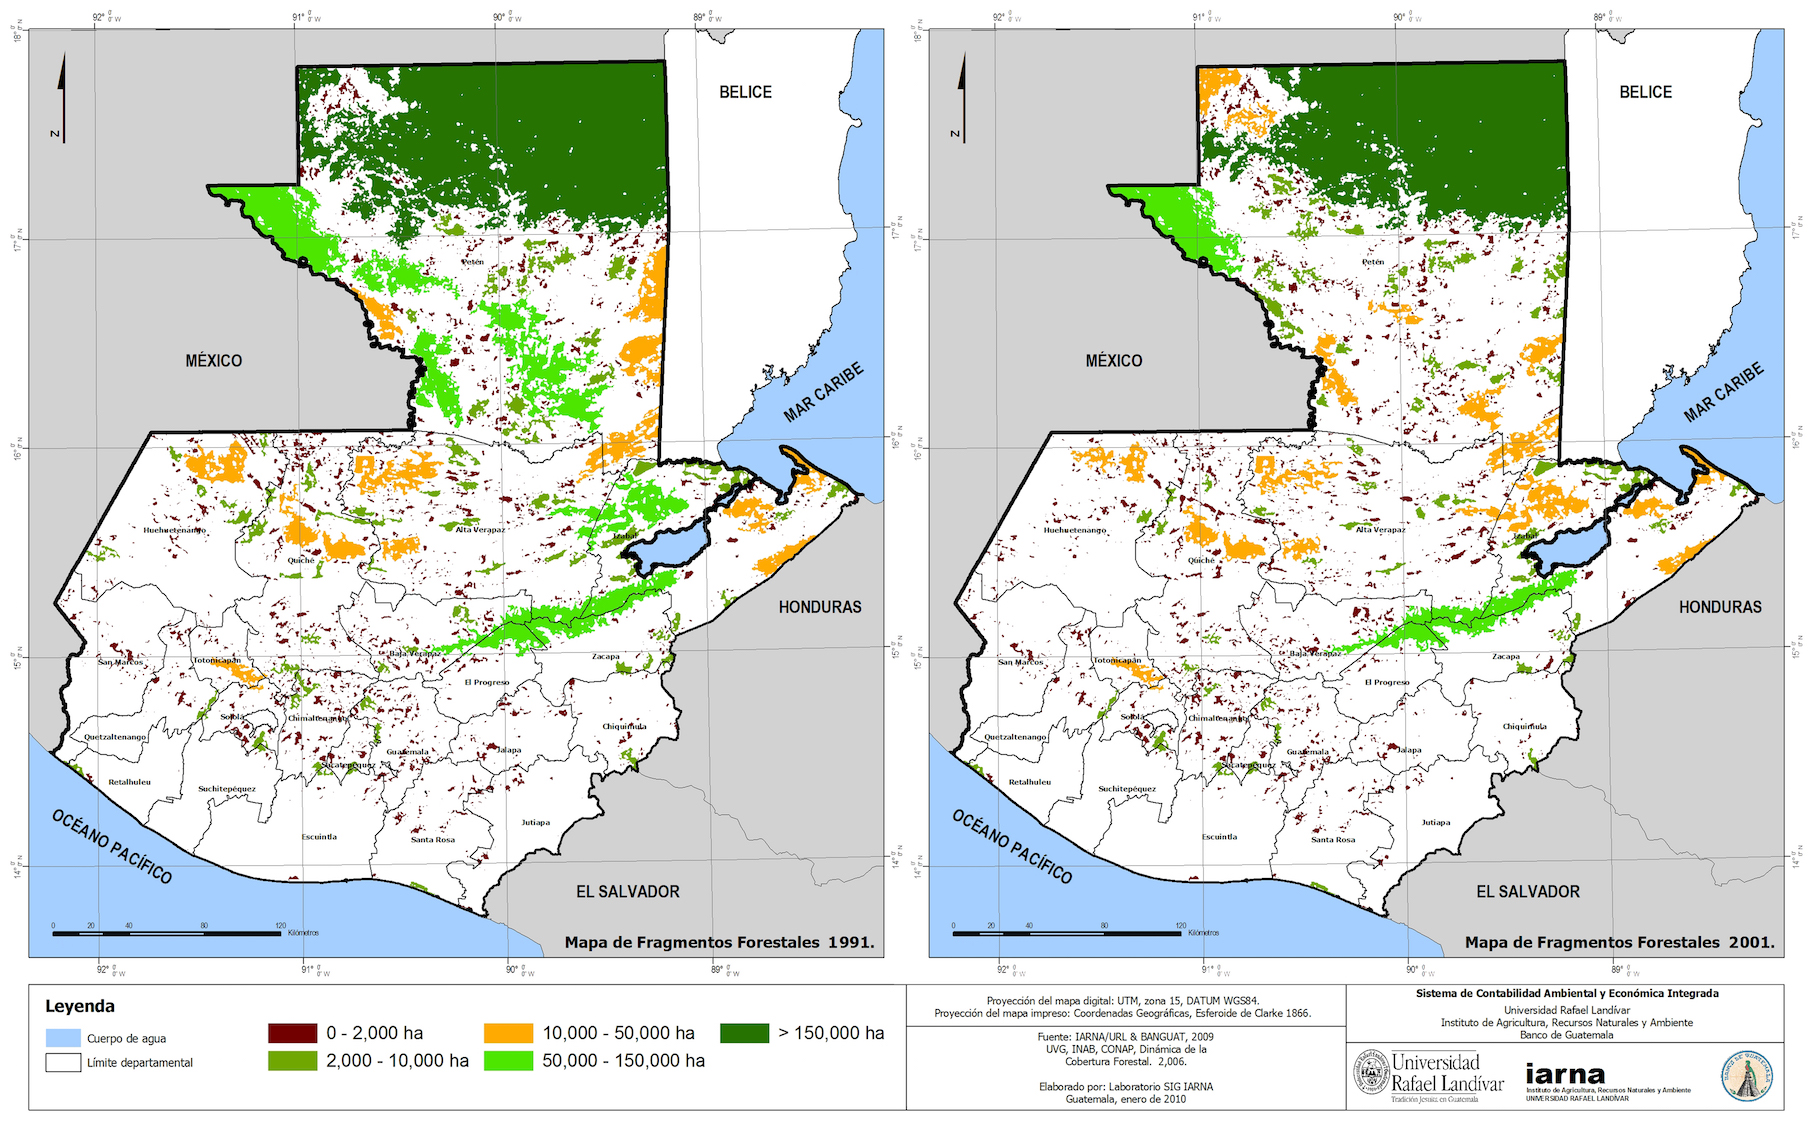 Figure 6. Evolution of forest fragments between 1991 and 2001 (click to enlarge)
There were, however, three regions with fragments large enough to guarantee a minimum ecological integrity, with a surface of 1.4 million hectares, equivalent to 13% of the country’s area. These were located in three eco-regions: Rainforest of Petén-Veracruz, Bosque Montano de Centroamérica, and Belicean Cost Mangroves.
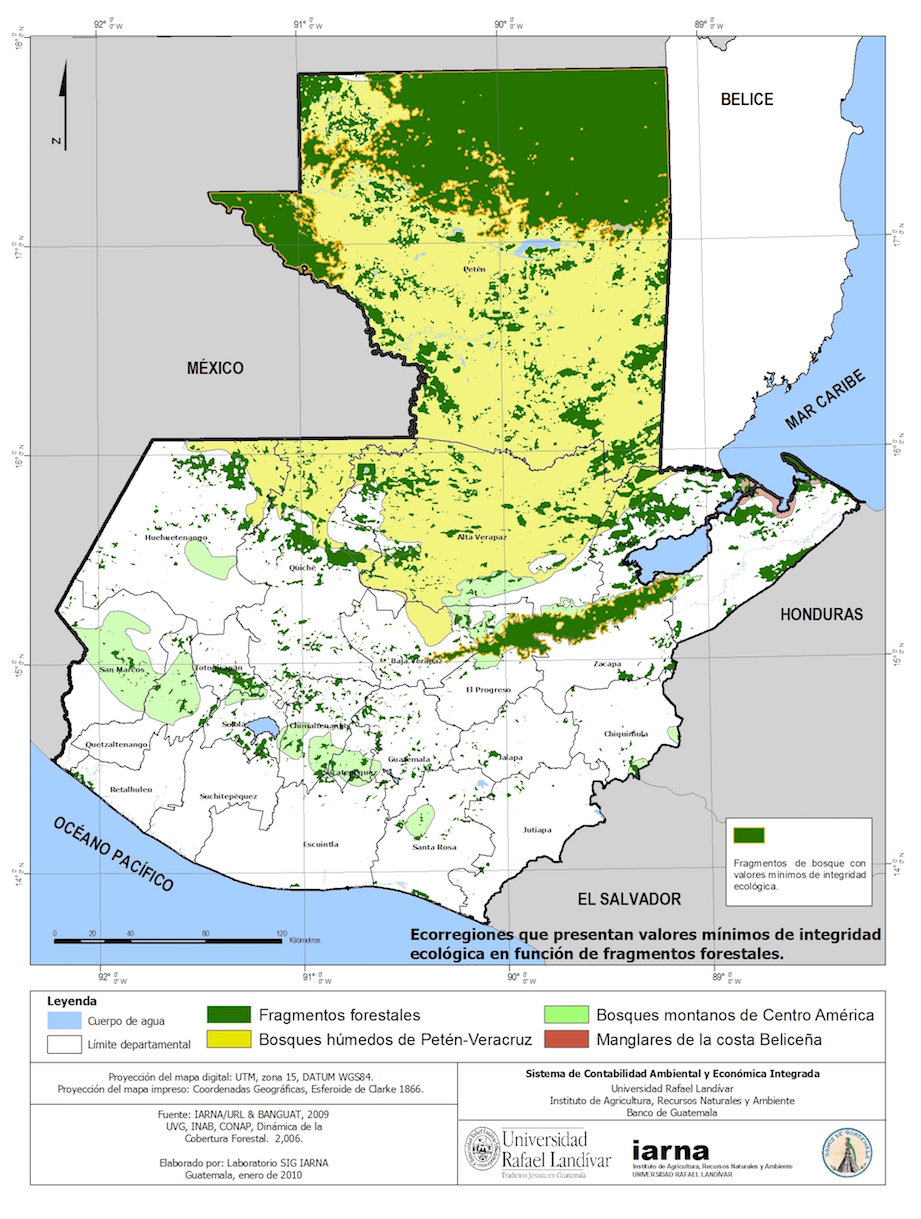 Figure 7. Forest fragments with ecological integrity (2003)
A total of 73% of the 880,200 hectares that lost their forest cover between 1991 and 2003 became lands for agricultural uses. This is consistent with the transformation of 642,424 hectares of forest to annual and perennial crops (133,230 hectares), shrubs and bushes (289,133 hectares), and pastures (133,230 hectares). About 80% of forests from Arbustal espinoso del Valle del Motagua, Rainforests of the Chiapas Sierra Madre, Rainforests of Petén-Veracruz, and Dry Forests of Central America, changed to either crops, shrubs, bushes, or pastures.
We evaluated the loss of two environmental services in order to determine effects of the degradation of forests. On the one hand we assessed the loss of the ability of forests to control erosion, and on the other we studied their capacity to store carbon. Our data showed that losses regarding these factors were equivalent to Q2,919.4 million (about $374.3 million) between 1991 and 2003.
Deforestation in the various regions resulted in the loss of 15 million tons of soil in the form of erosion, equivalent to Q1,150 million (about $147.4 million). We obtained these numbers from the loss of macro-nutrients (nitrogen, phosphor, and potassium) in every ton of eroded soil, depending to its category. Regions with the most losses were Rainforests of Petén-Veracruz (Q.733.5 million or $94 million), and Pine-Oak Forests of Central America (Q.237.3 million or $30.4 million).
As a consequence of the loss of forest cover, 368,622,243 tons of CO2 were released into the atmosphere, with at total cost of Q.1,769.4 million (about $226.8 million) at international carbon market prices. Of these losses, 85% can be attributed to the loss of forest cover in the Rainforests of Petén-Veracruz and the Pine-Oak Forests of Central America.
In this essay we reviewed the findings of the land and ecosystems account of Guatemala. This account is a framework that determines the current status of the different eco-regions of Guatemala in physical terms and quantifies the rate of their use through an analysis of land use change and its effects on forest cover.
For analytical purposes, Guatemala was subdivided in 14 eco-regions. Five of these represent 90% of the entire area of the country, and the two largest are the Rainforests of Petén-Veracruz (44% of total area) and the Pine-Oak Forests of Central America (27%).
Three of these eco-regions had less than 20% forest cover and eight more than 50%. A total of 880,220 hectares of forest cover hectares were lost between 1991 and 2003. From 1991 to 2003 a total of 25% of forest cover was lost to both annual and perennial crops.
Out of 12 more representative regions, nine showed poor biophysical conditions of connectivity and minimum fragment size in order to guarantee their ecological integrity and the provision of natural goods and services.
There is a need to ensure the conservation of the four forest fragments, equivalent to 13% of Guatemala’s total area, which show minimum values of ecological integrity.
It is imperative to begin restoration efforts in the rest of eco-regions; especially in the Pacific Basin, where land use change have diminished its ecological integrity to the minimum.
| Name | Type | Link |
|---|---|---|
| Land and Ecosystem account tables 2001-2001 (In Spanish) | xlsx | Download |