Waste
Waste accounting in Guatemala
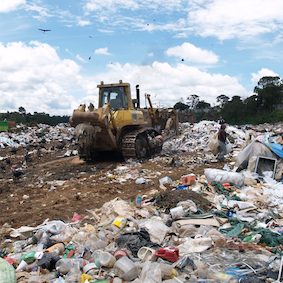
Between 2001 and 2006, the Guatemalan economy generated an average of 97.5 million metric tons of solid waste annually. Of this total, 98% came from the production of goods and services, and only about 2% from households.
The environmental account for waste is a framework that describes in detail the production, reuse, disposal and the various types of residuals generated by the different stakeholders in the economy. It makes a link between information on solid residuals and economic indicators. More specifically, it:
One of the first findings when putting together this framework is that waste is a growning problem. Between 2001 and 2006, waste production grew over 70%, going from 81.9 million metric tons in 2001 to 113.8 million in 2006. Waste production by economic industries grew a total of 39.4% during those years, while that of households reached 12.4%. While economic growth is important, we have to acknowledge the increase in waste that that represents and define clear waste management strategies and market rules.
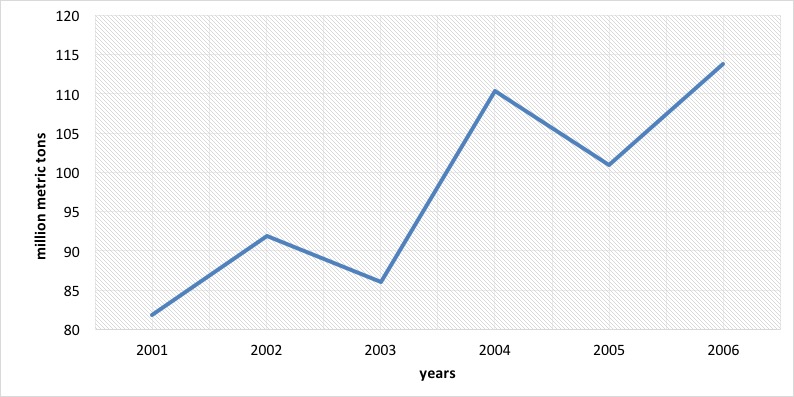 Figure 1. Waste production trend in Guatemala 2001-2006 (million metric tons)
It is interesting to note that the single industry with the most waste production is the manufacture of meat products which grew steadily between 2001 and 2004, with a slight decrease in 2005. Another relevant industry is the manufacture of chemical products, which tripled its waste production between 2001 and 2006, and in the case of the non-metallic mineral extraction industries we estimated an increase in waste from 10.1 million metric tons in 2001 to 13.8 million in 2006. Agriculture remained stable with 12.7 million metric tons in 2001 and 13.5 in 2006.
Waste comes in a variety of forms, and because of this it is important that we use a consistent classification that allows us to compare and monitor over time. The waste account provides estimates for:
In Guatemala, the top producers of waste are manufactures (53.8 million metric tons), and agriculture (19.1 million metric tons). In the first case, the most relevant individual industries were the production of meat products, the production of canned and preserved fruits and legumes, sugar milling, and the production of non-alcoholic beverages, while in the case of agriculture traditional and non-traditional crops were the most important. Some of the most important levels of solid waste output are summarized by selected industries below:
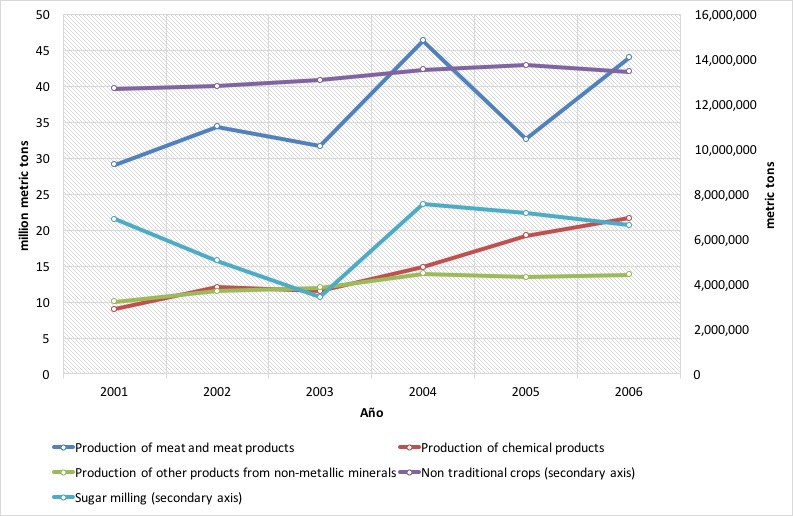 Figure 2. Solid waste output in Guatemala 2001-2006 (million metric metric tons)
Muds are an interesting residual, produced mainly by the chemical industry and to a minimum extent by sugar milling. In 2006 this type of waste reached 22.5 million metric tons.
Mineral waste is mainly produced by manufactures as well; specifically, by the production of other non-metallic products. In 2006 a total 13.8 million metric tons of this waste were produced. Other mining industries also contributed to this total. In 2006 non-metallic waste reached 1.6 million metric tons, mainly due to rubber and plastic production among the group of manufactures. Interestingly, households contributed 0.5 million metric tons to this category and, also relevant, sugar milling contributed 0.4 million metric tones of stabilized waste.
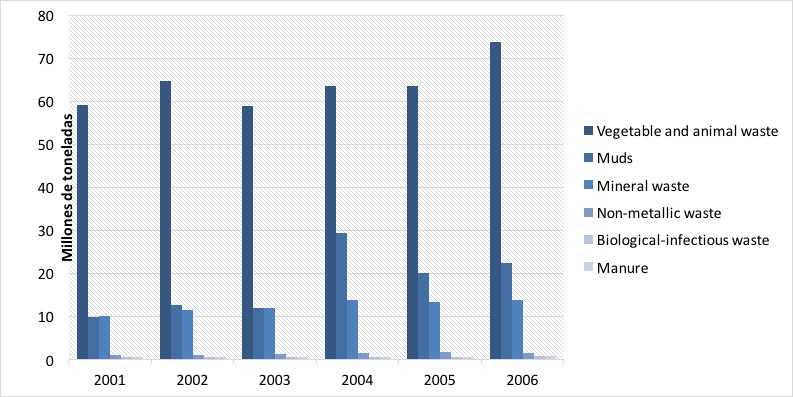 Figure 3. Solid waste output by selected types 2001-2006 (million metric metric tons)
The Guatemalan manufacturing industries are the largest re-users of the various types of waste. While reuse showed a general stable trend, towards the last year of analysis (2006) there was a relevant spike, reaching about 10 million metric tons. This number is 44% higher than that of 2001 and 36% higher than that of 2005. The production of electricity is also important in the reuse of waste with about 6 million metric tons in its highest year—2004. A distant third, the industries related to agriculture fluctuate around a reuse of a million metric tons. Households and service industries reused waste at a much lower scale.
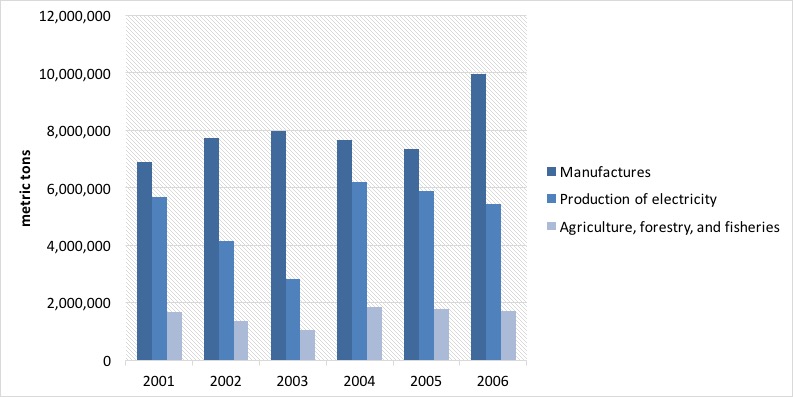 Figure 4. Waste reuse by groups of industries 2001-2006 (metric tons)
When we breakdown waste reuse by type, we see that vegetable and animal waste takes up the largest share of this total with 15.5 million metric tons, mainly attributed to the reuse of sugar cane bagass by the electricity production industry. Other important residuals are muds, manure, and stabilized residuals, which are used in their entirety by agriculture, forestry, and fisheries (0.8, 0.5, and 0.4 million metric tons, respectively). In average, about 15% of waste is reused in Guatemala; in 2001 this value reached about 17%, with the lowest value being 14% in 2003.
Table 1. Waste reuse by type of waste in 2006 (metric tons)
| (1) | (2) | (3) | (4) | (5) | (6) | Total | |
|---|---|---|---|---|---|---|---|
| Biological-infectious waste | - | - | - | - | 4,041.4 | - | 4,041.4 |
| Discarded equipment | - | 5,443.1 | - | - | - | - | 5,443.1 |
| Stabilized residuals | 413,581.3 | - | - | - | - | - | 413,581.3 |
| Manure | 463,433.0 | - | - | - | - | - | 463,433.0 |
| Muds | 827,162.6 | - | - | - | - | - | 827,162.6 |
| Vegetable and animal waste | - | 9,974,261.4 | 5,436,292.9 | 19,659.2 | - | 26,803.5 | 15,457,017.0 |
| Total | 1,704,176.9 | 9,979,704.5 | 5,436,292.9 | 19,659.2 | 4,041.4 | 26,803.5 | 17,170,678.5 |
“(1) Agriculture, forestry, and fisheries; (2) Manufactures; (3) Electricity; (4) Wholesale and retail trade; (5) Real estate, businesses; (6) Households and other final consumption.
Source: Iarna/Banguat (2009)
The difference between that which becomes waste, and the fraction that is reused goes straight to the environment. In the case of Guatemala, the largest flow of waste to the environment is vegetable and animal waste; about 58.3 million metric tons, or about 60% of total residuals. Manufactures contribute the most of these types of waste with about 44 million metric tons, followed by the group of agriculture, forestry, and fisheries with 19 million metric tons. Muds are second in importance, which represent about 22% of total waste disposal, and are the sole responsibility of industries. Mineral waste represents 14% of total disposal, and is also a flow that comes from manufacturing industries (13.7 million metric tons). Finally, non-metallic waste is also relevant, with 1.6 million tons, but it only represents about 2% of total disposal, and it is contributed by manufactures and households.
Among other things, waste management depends on the level of public expenditure allocated for it. In 2006, that value reached GTQ 1.4 billion, of which 56% comes from departmental governments, 33% from local municipalities, and 11% from the central government. In this last case, this type of expenditure represents only 0.4% of total environmental expenditure made by the central government, and for departmental and local governments 3% and 1%, respectively. Waste management reaches about 1.3% of total country environmental expenditure.
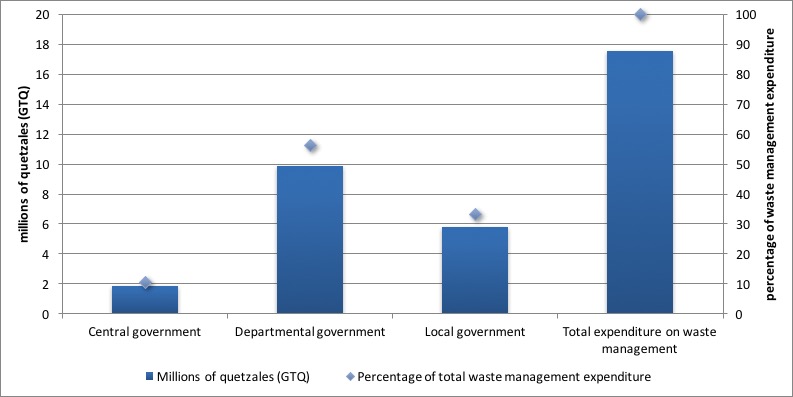 Figure 8. Environmental expenditure destined to waste management (millions of GTQ and percentages)
It is possible to evaluate the amount of waste generated for every monetary unit of value added (quetzales) contributed to GDP. In 2004 this intensity reached its highest point with 527 metric tons of waste per unit of value added, and by 2006 that number had dropped to 443 metric tons. This means that the pressure on the environment in terms of waste is relatively high.
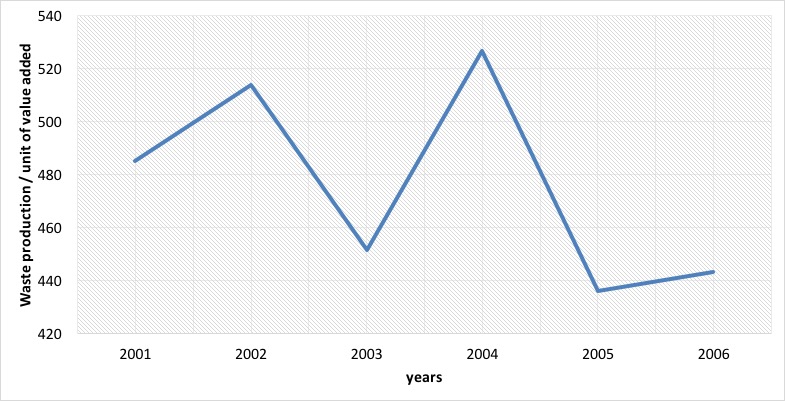 Figure 9. Waste intensity (waste output / value added)
In this essay, we introduced a framework for the analysis of waste disposal at a national level, based on the System of Environmental and Economic Accounts. The waste account of Guatemala describes in detail the production, reuse, disposal and the various types of residuals generated by the different stakeholders in the economy. It makes a link between information on solid residuals and economic indicators. From its findings, we found relevant that: