Water
Water accounting in Guatemala
Water accounting showed that upward of 98% of the water used by the economy is not taken into account by our usual economic performance measures, leading to poor economic decisions with regards to this natural resource.
The water account of Guatemala is a framework with which we describe the intricate relationships between the economy and the use of water as a natural resource. Information on water sources is linked with information about the various stakeholders in the economy, such as industries and consumers. More specifically, the water account:
We first turn to the use of water, which we can understand as either consumption of water in processes that delay its return to the water cycle, such as household uses, industrial uses, and agricultural uses, as well as its use in processes that return it immediately to the environment, such as electricity generation. Figure 2 shows some variation in the use of water between 2001 and 2006 and results suggest that a slowdown of the production of coffee at the beginning of the decade might have contributed in a relevant manner to this behavior.
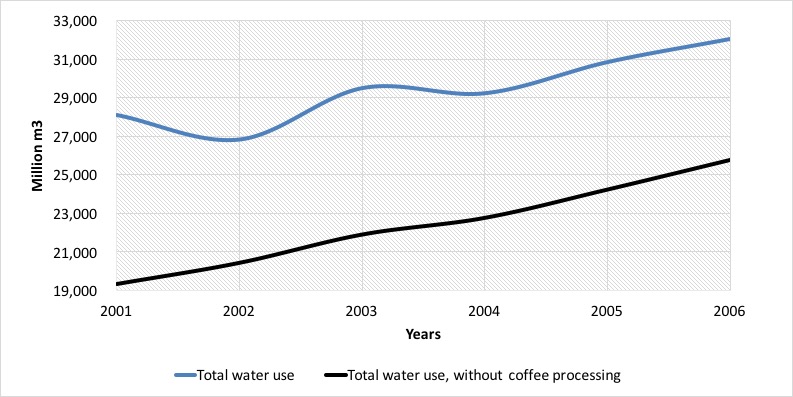 Figure 1. National water use with and without coffee processing (million m3)
The coffee processing industry is one of the largest users of water in Guatemala. In fact, next to the production of corn, which is highly dispersed among small landowners, coffee is one of the crops that covers more surface area in the country. However, data from the National Coffee Producers Asociation (ANACAFE) show that coffee production, which reached close to 286 thousand metric tons in 2001, saw a 27% drop the following year, bouncing back in 2003, but stabilizing at a lower 204 metric tons for the remainder of the analysis period. Notwithstanding, if we remove the data corresponding to coffee from the series (which we can also see in figure 2), then the trend of water use by the remaining industries was of steady growth.
Another interesting indicator is that of water use per capita. This indicator links total water use to a population headcount for each year. Table 7 shows this indicator for our accounting years. It is evident that water use per capita reached its most significant number in 2006 with a total of 2,459 m3 per inhabitant.
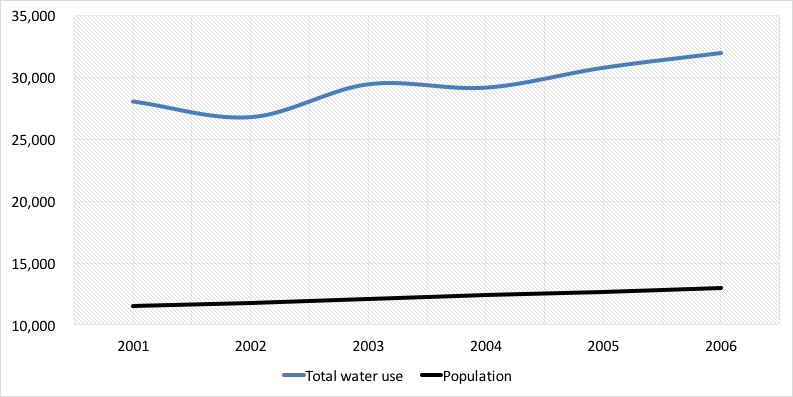 Figure 2. National water use (million m3) and population (thousands of inhabitants)
Figure 2 shows an erratic behavior in the use of water with a steady growth of 2.5% of the Guatemalan population. This suggest that population growth is a poor indicator of water use variation. If we don’t take into account the processing of coffee, water increased at a rate of between 4% and 7% between 2001 and 2006, a trend which is likely to continue in the future.
To answer this question, we first turn to the agricultural industries. In our analysis, we took into account the rain water that was used by crops in their different growth stages. This is called rainfed irrigation and we chose to include it because it reflects the real contribution of water to our economy in a better manner. Figure 4 shows the trend of the largest water using industries of Guatemala. As expected by the introduction above, rainfed agriculture is the largest of all water using industries, with a share of about 40% of total use. It is followed by manufactures, which used between 35% and 24% in the accounting years.
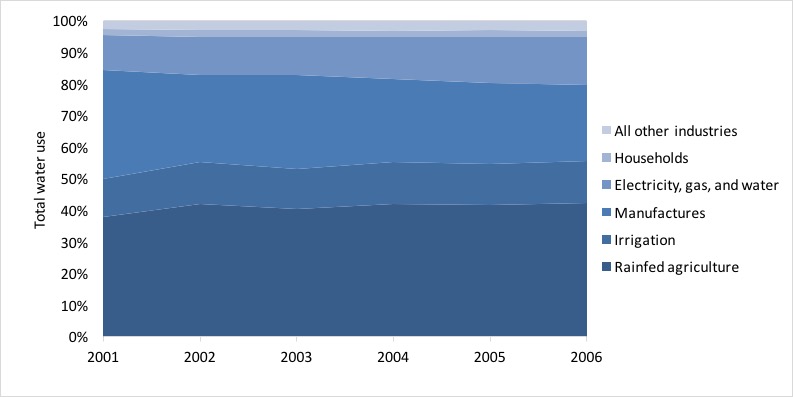 Figure 3. Shares of water use for selected industries (percentages)
Electricity generated with hydraulic power gained importance in the accounting period, going from about 11% in 2001 to 15% of total water use in 2006. In contrast to the figures presented before, irrigated agriculture represented about 10% of national water use in 2006, and about of 25% of the water used by all agriculture in general (about 4.3 million m3 in 2006).
Interestingly, households used less than 1.5% of total water use in Guatemala, and the remaining industries hovered around 3% and 4% annually.
As we explained before, the total amount of water used above includes rain water. However, there is also the concept of water extraction, which corresponds to water from an underground or surface source, and at the same time represents a consumption or severe change in its quality. This implies that neither hydroelectricity production or rainfed agriculture fit this description.
Figure 5 shows manufactures as the main extracting activities with a share of 62% of all extraction in 2003, which is estimated at 14,038 million m3. Another important industry in this sense is irrigated agriculture, which was responsible for about 27% of total extraction in 2003. Coffee processing followed with 54% of extracted water, and sugar cane growing with about 12%. Households represented less than 3% of total water extraction in Guatemala.
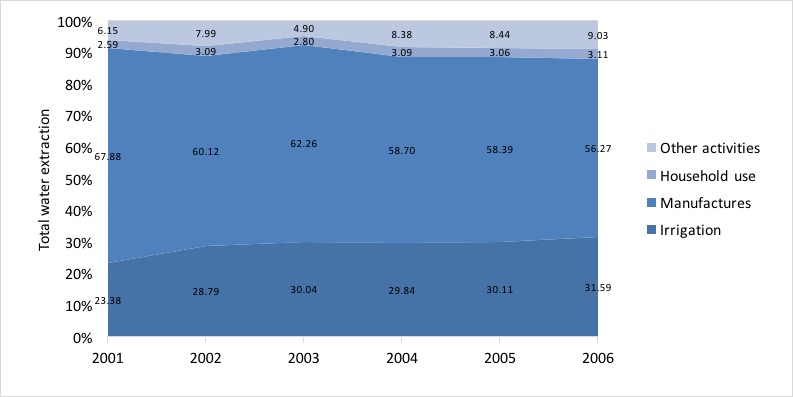 Figure 4. Water extraction for selected industries (percentages)
The amount of water used by different crops depends on the different requirements of each cycle of plant growth, total cultivated area, total area under irrigation, and irrigation methods used. Table 1 shows estimates for the most important crops in Guatemala. This group represented about 87% of total water used by agriculture and 75% of the demand of water for irrigation in 2003. In this sense, sugar cane production stands out with 43% of total irrigation.
Table 1. Water used by the most important crops in Guatemala. (million m3 and percentages)
| Crops | Rainfed agriculture | Irrigated agriculture | ||
|---|---|---|---|---|
| Volume | Percentage | Volume | Percentage | |
| Banana | 308,485,229 | 2.59 | 517,090,909 | 13.69 |
| Coffee | 2,541,335,533 | 21.35 | 0 | 0.00 |
| Sugar cane | 2,089,164,485 | 17.55 | 1,636,521,421 | 43.34 |
| Cardamum | 674,366,183 | 5.66 | 0 | 0.00 |
| Beans | 932,256,561 | 7.83 | 0 | 0.00 |
| Maize | 3,820,696,316 | 32.09 | 0 | 0.00 |
| Mango | 87,470,637 | 0.73 | 80,795,454 | 2.14 |
| Melon | 31,868,075 | 0.27 | 126,376,488 | 3.35 |
| African palm oil tree | 421,783,476 | 3.54 | 469,444,799 | 12.43 |
| These crops | 10,907,426,494 | 91.62 | 2,830,229,071 | 74.96 |
| Other crops | 997,502,349 | 8.38 | 945,661,520 | 25.04 |
| Total Agriculture | 11,904,928,843 | 100.00 | 3,775,890,591 | 100.00 |
Source: Iarna/Banguat (2010)
Regardless of whether crops are irrigated or not, it is evident that water is of extreme importance to food security (staple foods) and exports (sugar cane and coffee).
Manufacturing industries used around 8.7 million m3 of water in 2003. Table 9 shows selected industries with the largest uses. Once again, coffee processing stands out with an 87% share of all water used by manufactures (about 7.6 million m3). Other important groups of manufacturing industries are food production and sugar production with around 8% and 2.5% of total water used by manufactures, respectively.
Table 2. Largest water uses among manufacturing industries. (million m3 and percentages)
| Industry | Volume | Percentage |
|---|---|---|
| Coffee processing | 7,591,184,950.80 | 86.86 |
| Food processing | 687,756,805.01 | 7.87 |
| Sugar production | 218,758,014.48 | 2.5 |
| Mineral water production | 76,060,252.40 | 0.87 |
| Clothing | 19,337,213.44 | 0.22 |
| Other textiles | 10,506,187.93 | 0.12 |
| Meat processing | 10,417,872.57 | 0.12 |
| Subtotal | 8,624,380,482.43 | 98.56 |
| Other industries | 115,569,084.74 | 1.44 |
| Total | 8,739,949,567.17 | 100 |
Source: Iarna/Banguat (2010)
It is important to point out that the third largest use of water in the country is the production of electricity. This industry may only use water and not consume it, but its final product—electricity—makes a relevant contribution to the generation of wealth in the economy (or gross domestic product). In 2001 the share of total water use of electricity production was 11% and it grew to 15% towards the end of the analysis years; in 2006.
On the other hand, water used to satisfy direct human needs represented around 3% of total extraction in the years 2001-2006. In 2003, total water used by households was estimated at 392.7 million m3. We made this calculation taking into account that water use varies from urban to rural areas, from administrative region to region in the country, and also given different kinds of access to water of households. Table 10 shows these results by department. A total of 59% of all household consumption of water happens in urban areas, and about a third of national household water is used in the department of Guatemala, where the capital city is located; the largest in the country.
Table 3. Household water use for selected departments; urban and rural areas. (million m3)
| Department | Urban | Rural | Total |
|---|---|---|---|
| Guatemala | 120,877 | 13,035 | 133,912 |
| Alta Verapaz | 6,238 | 17,828 | 24,067 |
| San Marcos | 6,903 | 16,061 | 22,964 |
| Quetzaltenango | 13,727 | 7,178 | 20,905 |
| Escuintla | 9,542 | 8,784 | 18,326 |
| Huehuetenango | 6,351 | 10,660 | 17,012 |
| Rest of departments | 69,036 | 86,472 | 155,509 |
| Total | 232,674 | 160,018 | 392,695 |
Source: Iarna/Banguat (2010)
In the System of National Accounts of Guatemala only water that is the subject of economic transactions is recorded, and given the institutional framework of water access in Guatemala, most water uses do not fit that category. Most rain water and water extracted from wells for own use in industry and some residential complexes is not the subject of payments between economic stakeholders, and so it is not recorded by the system of national accounts. There is however an exception, and that is the small fraction of water that is channeled through municipal or private distribution companies and which is charged to some connected households and small to medium enterprises.
From our exercises already presented above we were able to compare and contrast the different volumes estimated by the System of National Accounts and water accounting. Figure 8 shows that upward of 98% of water is not recorded by our usual economic performance measures. In 2006, this represented over 31 million m3.
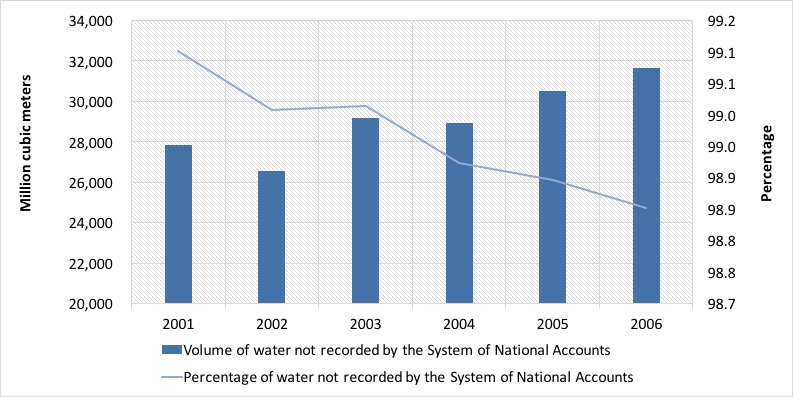 Figure 5. Water not recorded in the System of National Accounts
Furthermore, table 11 shows these differences for selected individual industries. For example, in agriculture over 80% of unregistered water corresponds to rainfed agriculture, but the grand majority of water for irrigation is also excluded from typical gross domestic product calculations. And even for households, which are the main clients of private and municipal water distribution systems, recorded water only accounts for about 20% of their total use.
Table 3. Water not recorded by SNA for selected industries (million m3)
| Selected industries | Recorded by SNA | Not recorded by SNA |
|---|---|---|
| Coffee production | 37,120 | 2,541,335,533 |
| Banana production | 0 | 825,576,138 |
| Cereals production | 0 | 4,013,236,479 |
| Production of other crops (including sugar cane) | 736,978 | 3,944,990,546 |
| Coffee processing industry | 0 | 7,591,184,951 |
| Food processing industry | 1,344,646 | 687,756,805 |
| Sugar production | 1,758,014 | 217,000,000 |
| Electricity generation | 220,152 | 3,546,433,255 |
| Households | 62,175,931 | 330,560,455 |
Source: Iarna/Banguat (2010)
We have described the importance of water for various production and consumption processes in the economy using the framework of the System of Environmental and Economic Accounts.
For most economic industries water use had a growing trend, with the exception of coffee production—the largest individual user of water—. Due to external shocks in international coffee markets, there was a significant drop in production of this commodity, which in turn translated into a lower demand for water for the entire Guatemalan economy.
In 2006, water use per capita reached a total of 2,459 m3 per inhabitant. This is closely related to total household water consumption, which interestingly was less than 1.5% of total water use in Guatemala in that year.
There is a difference between water use and water extraction. The latter implies an abstraction of water from the natural environment. About 56% of all water extraction can be attributed to manufacturing industries in 2006, with about 30% going to irrigated agriculture. All the other industries and services and households account for the remaining share of about 12%.
It is interesting to note that coffee processing is by far the industry that uses the most water, with a share of about 86% of total water use. This knowledge is key for the design of better public policies regarding irrigation districts, and forest incentives in order to protect water sources and increase water provision.
Regarding the effectiveness of SNA to capture interactions between the economy and the environment, our data show that upward of 98% of water is not recorded by our usual economic performance measures. In 2006, this represented over 31 million m3. Since macroeconomic performance measures are used by economic agents to make decisions, the oversight of such a large amount of water use might lead to unsustainable economic decisions and to supply shocks in the future.